Our investment banking team at Forvis Mazars Capital Advisors has the privilege of working with business owners across numerous industries. With our focus on sell-side advisory, we are keenly aware of current merger and acquisition (M&A) market conditions. In this article, we will provide recent data and commentary related to middle-market M&A activity through the fourth quarter of 2024.

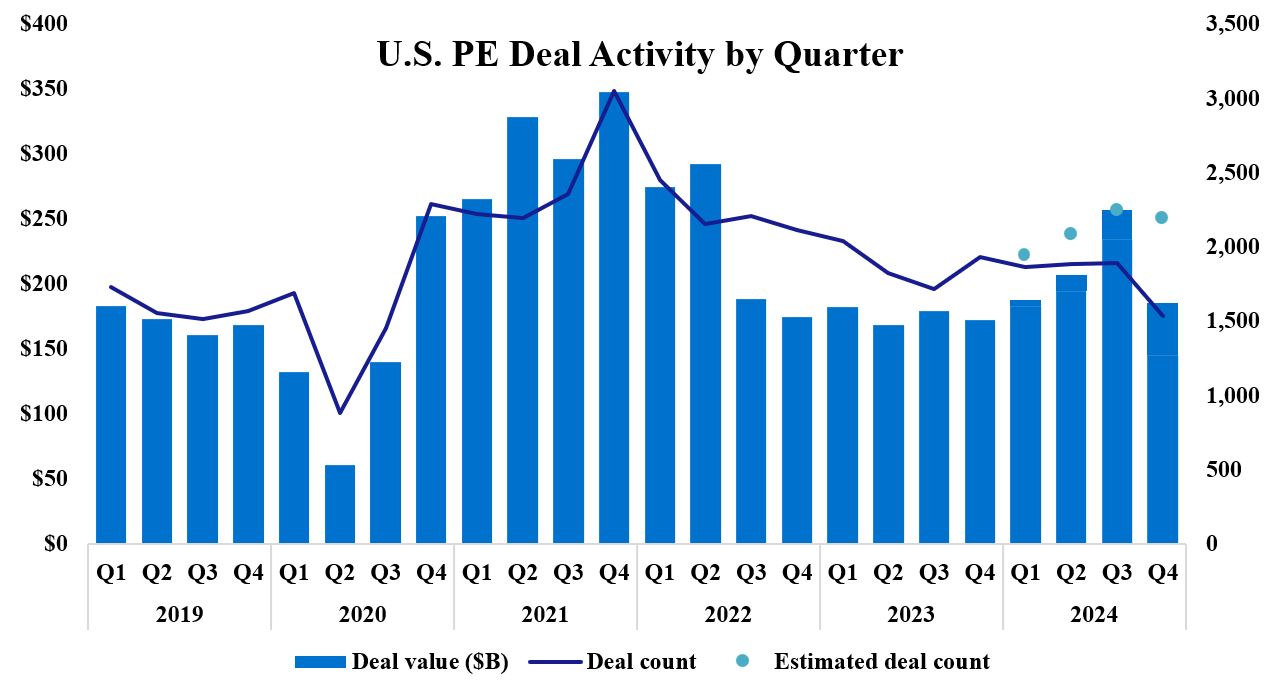
Source: Pitchbook, Median U.S. PE Deal Activity by Quarter (2024)
Deal Volume Commentary
- Coming off a disappointing 2023 for M&A activity, dealmakers anticipated robust deal activity heading into 2024. After a slow start to the year, U.S. private equity (PE) deal volume gained momentum through Q3, before tailing off slightly in Q4 and eventually posting a full-year 12.8% deal count growth in 2024. The estimated M&A volume was reasonably strong at the end of the year, with the estimated PE deal count for Q4 up 13.3% quarter over quarter. While both Q4 and full-year 2024 showed promising growth, overall deal volume did not meet expectations, with M&A activity rebounding slower than expected.
- Several tailwinds appear to be supporting higher levels of M&A activity moving into 2025, including lower interest rates, anticipated economic growth, and a business-friendly political environment following the November election. In addition, U.S. PE assets under management (AUM) reached all-time highs in 2024, eclipsing $3.5 trillion. While dry powder—or uncalled capital—fell as a percentage of total PE AUM, dry powder levels remain elevated at more than $1 trillion. There is significant capital to be deployed by PE in the year to come and beyond.
- While there was general growth in M&A activity, some industries fared better than others in 2024. Software-related PE transactions were up 27.5% year over year, while PE activity in Industrials was down 9.1% year over year.
Total Enterprise Value (TEV)/EBITDA

Source: GF Data, February 2025 Report (gfdata.com)
TEV/EBITDA – Quarterly Splits

Source: GF Data, February 2025 Report (gfdata.com)
TEV/EBITDA – By Industry ($10–$250M TEV)

Source: GF Data, February 2025 Report (gfdata.com)
Valuation Metrics: General Commentary
- When considering valuation metrics, we’ve included transaction data of less than $500 million in enterprise value, with the data provided by GF Data, an Association for Corporate Growth (ACG) company. This data set offers compiled and segmented data for a variety of key factors, including industry and company size. The data set is compiled quarterly from transactional deal statistics provided by more than 400 PE firms to GF Data.
- As noted on the “Total Enterprise Value (TEV)/EBITDA” table above, the average TEV/ Earnings Before Interest, Taxes, Depreciation, and Amortization (EBITDA) multiple for 2024 sat at 7.2x, which is flat compared to the previous year. Notably, multiples have yet to reach the peak levels seen in 2021. Looking at quarterly data, the TEV/EBITDA multiple for Q4 2024 was 7.3x, the same as Q4 2023. Notably, deals in the $10–25 million range, which is the most reported-on size range from GF Data, saw the average multiple increase from 6.2x in Q4 2023 to 6.6x in Q4 2024. This is the highest level for this category over the past two years.
- The manufacturing and retail sectors saw year-over-year increases in their average TEV/EBITDA multiple, with manufacturing increasing from 6.5x to 6.9x, and retail growing from 6.0x to 7.9x, respectively. Other industries were not as resilient, with business services, healthcare services, distribution, media and telecom, and technology all recording a year-over-year decrease in their average TEV/EBITDA multiple. Technology was hit the hardest, with the TEV/EBITDA multiple down about 21% during the year, moving from 10.2x in 2023 to 8.1x in 2024.
Buyouts With Above-Average Financial Characteristics

Source: GF Data, February 2025 Report (gfdata.com)
Quality Premium – Buyouts Only (TEV $10-500M)

Source: GF Data, February 2025 Report (gfdata.com)
Premium Valuations for Quality Businesses
- GF Data’s recent report signals the continuance of quality businesses receiving premium valuations from investors. GF Data defines “Above-Average Financial Characteristics” as companies with a minimum 10% EBITDA margin and a minimum 10% trailing-12-month revenue growth.
- As noted in the “Quality Premium – Buyouts Only (TEV $10-500M)” table above, companies classified as having “Above-Average Financial Characteristics” by GF Data received a 15% valuation premium in 2024 when compared to their “less robust” peers. While not as elevated as the premium that was paid from 2020 to 2023 (ranging from 22% to 28%), businesses that produce strong cash flows, grow revenues, and maintain high margins will likely continue to see superior valuations versus their weaker counterparts. In addition, businesses with these characteristics often draw a higher number of interested bidders during a sale process. This incremental competition typically offers an additional valuation driver.
Forvis Mazars Capital Advisors
With diverse transaction experience spanning multiple industries, Forvis Mazars Capital Advisors’ investment banking team exists to serve companies owned by founders, entrepreneurs, and families. We understand, appreciate, and embrace the professional and personal dynamics and considerations involved when selling a business. In addition, we recognize that every business is unique and is often its owners’ most valuable financial asset—one deserving of unparalleled care and attention.
If you are contemplating a business transition or are simply interested in learning more about the M&A process for business owners, please reach out to one of our professionals to schedule an introductory conversation.
