
At Forvis Mazars Capital Advisors, our investment banking team brings deep transaction experience and industry breadth to business owners across the middle market. With an in-depth focus on sell-side advisory, we are closely attuned to evolving merger and acquisition (M&A) market dynamics. In this article, we share recent data and insights on M&A activity through the second quarter of 2025, offering a perspective shaped by our direct engagement with active deal flow and a diverse set of capital allocators operating across core industries in the middle market.
U.S. Middle-Market Deal Activity Heading Into the Second Half of 2025
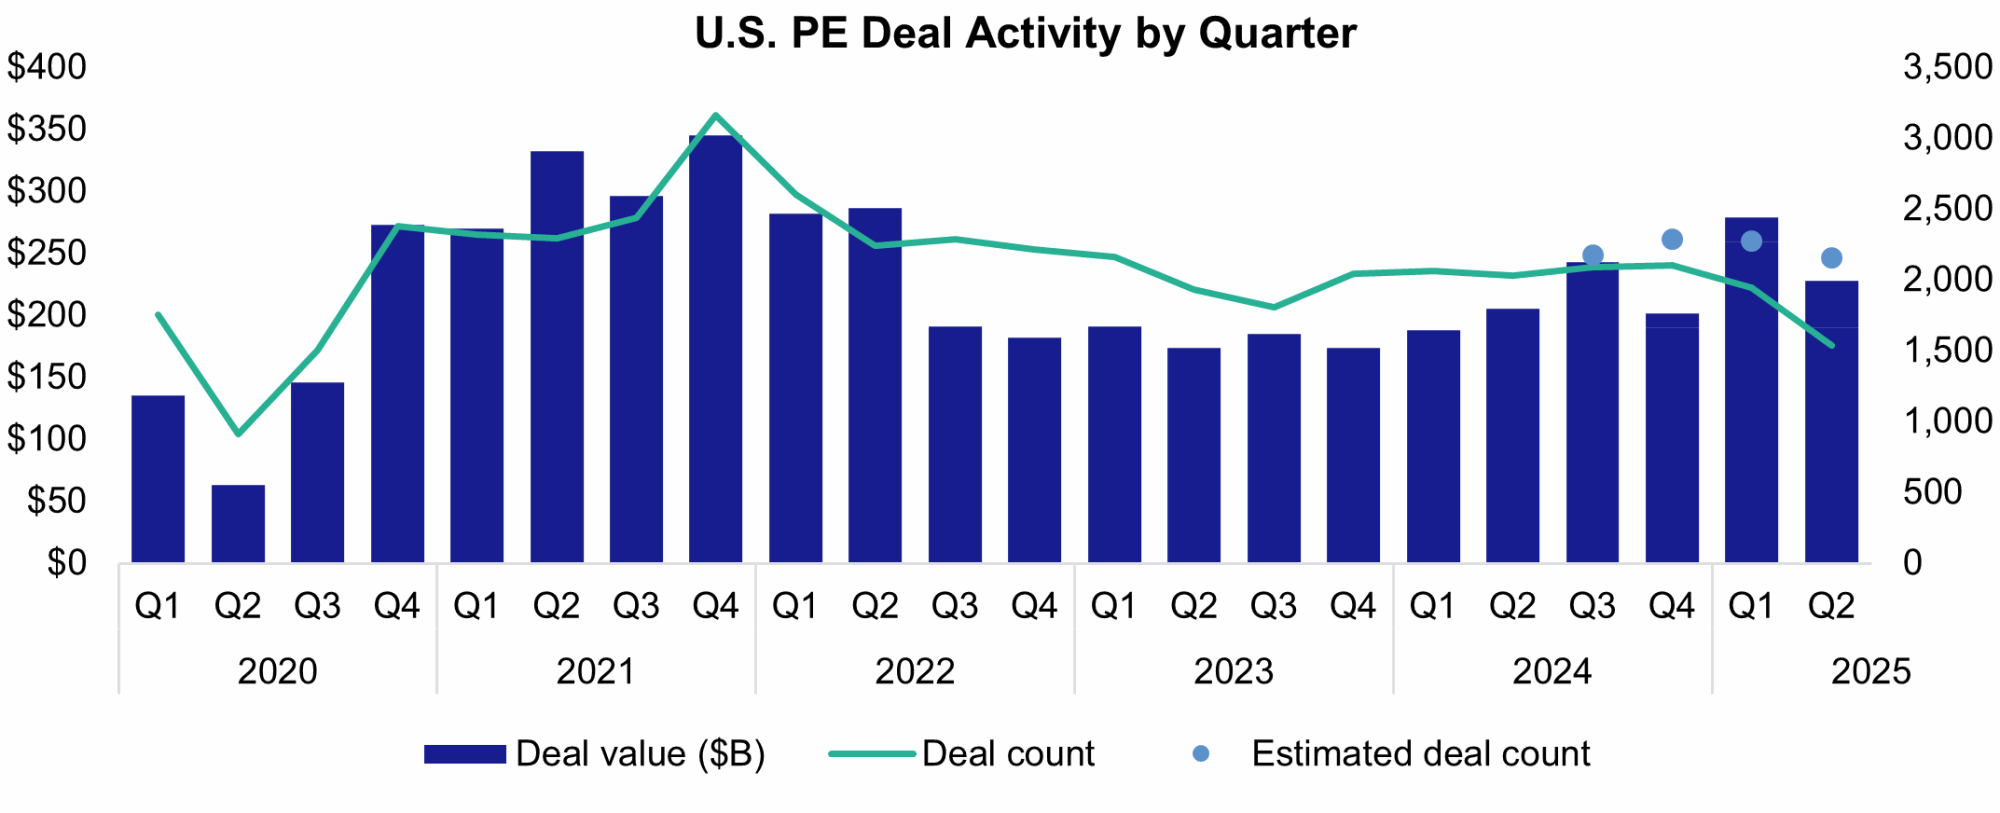
Source: Pitchbook, U.S. PE Deal Activity by Quarter
Although the year began with challenges, the U.S. M&A market is showing renewed momentum going into the second half of 2025. While deal volume for companies with enterprise values less than $500 million declined during the first half of 2025 compared to the same period in 2024, multiple indicators suggest the potential for a rebound, particularly within specific sectors of the middle market.
U.S. private equity (PE) deal activity demonstrated resilience in the second quarter of 2025 despite ongoing macroeconomic pressures and uncertainties related to tariffs. The quarter concluded with an estimated 2,158 transactions, a 5% decrease quarter-over-quarter, but a 6.3% increase year-over-year. Aggregate deal value totaled $227.7 billion, reflecting an 18.4% drop from the previous quarter but a 10.7% rise year-over-year, indicating improved performance in larger deals and enhanced clarity regarding U.S./China trade relations.
Nuanced Middle-Market Landscape
Total Enterprise Value (TEV)/EBITDA Multiples
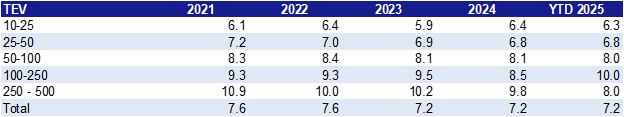
According to GF Data,1 valuations for companies acquired by PE firms have remained stable overall, with the average TEV/EBITDA multiple staying consistent at 7.2x year-to-date (YTD) 2025. Nonetheless, underlying deal dynamics are evolving. There is a notable increase in investor interest for transactions valued between $100 million and $250 million, where valuation multiples rose to 10.0x, compared to 8.5x seen in 2024. Valuation multiples for transactions less than $100 million have been generally stable over the past 18 months.
TEV/EBITDA Multiples by Industry ($10M–$250M TEV)
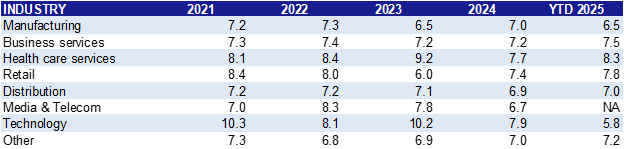
Sector preferences are also evolving. Healthcare, business services, and retail saw valuation gains, while manufacturing experienced a reset, dropping to 6.5x. These shifts reflect a more selective market, with buyers prioritizing defensible margins and operational resilience.
TEV/EBITDA Multiples All Industries by EBITDA Size
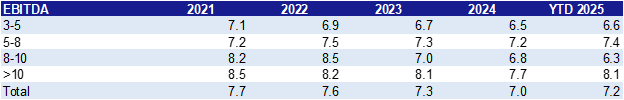
Valuation trends by EBITDA size show a relatively stable market with a slight upward shift in pricing for larger, more profitable businesses. The overall average TEV/EBITDA multiple across all industries increased modestly from 7.0x in 2024 to 7.2x in the first half of 2025. Smaller EBITDA deals in the $3 million to $5 million range held steady at 6.4x, while midrange deals ($5 million to $8 million) saw a slight increase, suggesting growing competition for scalable assets. The most notable movement was in deals with EBITDA greater than $10 million, which rose from 7.7x to 8.1x, reinforcing the premium placed on larger, more resilient companies. These shifts suggest that buyers are increasingly focused on scale and margin durability.
U.S. Middle-Market Catalysts: PE Dry Powder & Federal Reserve Anticipation
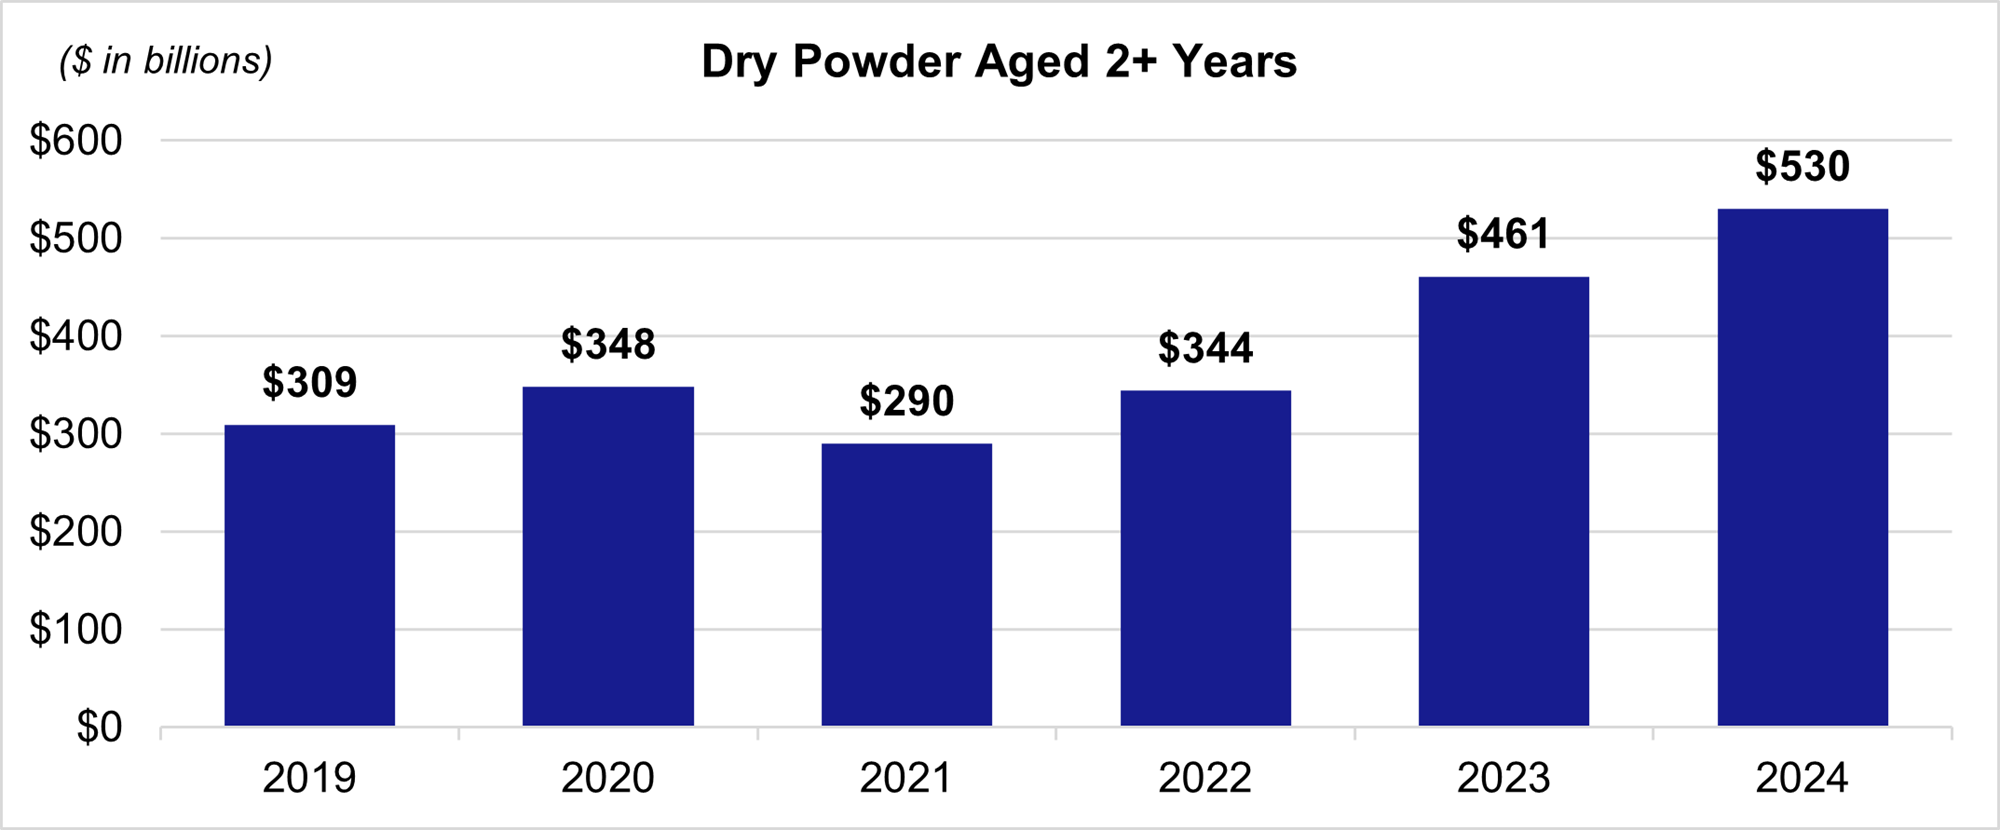
PE dry powder remains a defining feature of the current market landscape. Aged dry powder, defined as capital that has remained undeployed for more than two years, has surged from $290 billion in 2021 to $530 billion in 2024, marking an 82% increase. This sharp rise reflects a growing backlog in capital deployment (likely driven by cautious investment behavior and macroeconomic uncertainty). As pressure mounts to deploy this capital, sponsors may face increased competition for deals and a need to balance urgency with disciplined asset selection.
The Federal Reserve’s anticipated rate cuts in 2025 are emerging as a key driver of renewed momentum in M&A markets. After a cautious start to the year, sentiment is shifting as investors increasingly expect inflation to be contained and monetary policy to ease. This “Goldilocks” scenario, where growth remains resilient but cool enough to justify lower rates, is helping to stabilize financing conditions and improve valuation alignment between buyers and sellers. While the timing and magnitude of Fed action remain uncertain, the expectation alone is influencing deal flow activity and expectations.
If you have any questions or would like more information on investment banking, please reach out to a professional at Forvis Mazars.
- 1GF Data Q2 Data, gfdata.com, 2025.