Middle Market Deal Activities Have Stabilized and Uptick Expected
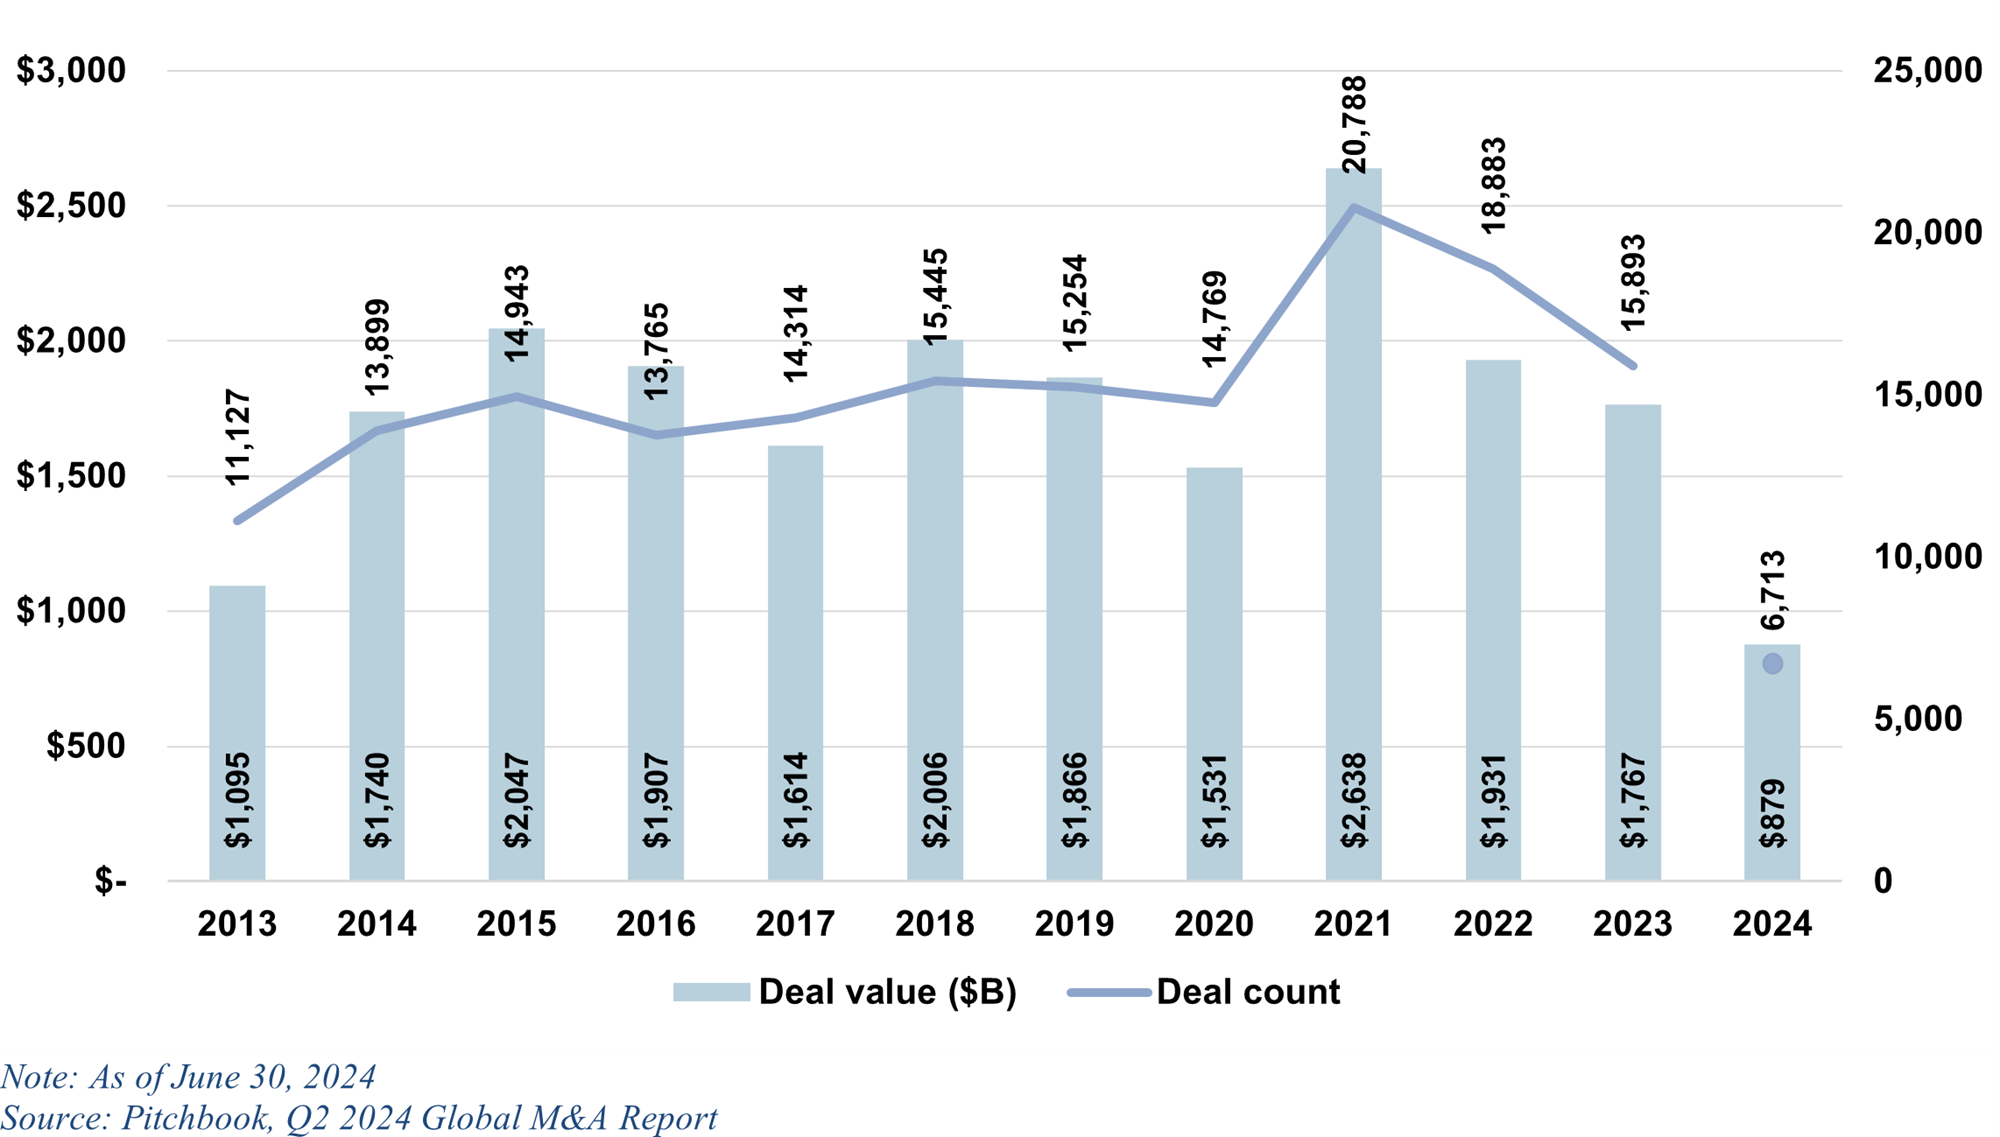
Our investment banking team at Forvis Mazars Capital Advisors has a unique position to observe and participate in current merger and acquisition (M&A) market conditions. As sell-side advisors, and based on our closings, we’re aware of market and transactional happenings across numerous industries. In this article, we’ll provide recent data and commentary related to middle-market M&A activity in the second quarter of 2024.

Deal Volume: General Commentary
- In the first half of 2024, North American M&A activity advanced by approximately 13.0% on a year-over-year (YOY) basis. This is meaningful growth, but the general consensus is this growth still trails the beginning of the year expectations. This year’s announced and planned interest rate reductions are fueling optimism for a stronger finish in 2024, and advanced activity in 2025.
- Sectors recording the most defined momentum in the first half of 2024 included energy, financial services, and information technology. Business-to-business (B2B) and business-to-consumer (B2C) enterprises remain among the most active industries, but both deal value and deal multiples have declined slightly in 2024 in these two core sectors.
Buyer mix has continued to favor strategic buyers. These buyers often have greater operational opportunities to address valuation gaps. This is the primary reason, in our view, that private equity’s eight-year streak of increasing deal volume was halted in 2023. We’re seeing stabilization of this valuation gap and expect this balancing will have a positive impact on deal activities in the balance of 2024 and 2025.
Total Enterprise Value (TEV)/EBITDA

| Tev | 2003-2019 | 2020 | 2021 | 2022 | 2023 | YTD 2024 | Total | N= |
|---|---|---|---|---|---|---|---|---|
| 10-25 | 5.8 | 5.9 | 6.1 | 6.4 | 6.0 | 6.4 | 5.9 | 1,994 |
| 25-50 | 6.5 | 6.7 | 7.2 | 7.0 | 6.4 | 6.7 | 1,536 | |
| 50-100 | 7.5 | 8.0 | 8.3 | 8.5 | 8.0 | 8.7 | 7.7 | 1,053 |
| 100-250 | 8.2 | 8.7 | 9.3 | 9.1 | 9.6 | 8.3 | 8.5 | 592 |
| 250-500 | 9.0 | 10.4 | 10.9 | 10.1 | 10.7 | 9.8 | 10.0 | 86 |
| Total | 6.6 | 7.0 | 7.6 | 7.5 | 7.2 | 7.1 | 6.9 | |
| N = | 3,611 | 342 | 501 | 334 | 293 | 180 | 5,261 |
Source: GF Data, “August 2024 Report,” gfdata.com.
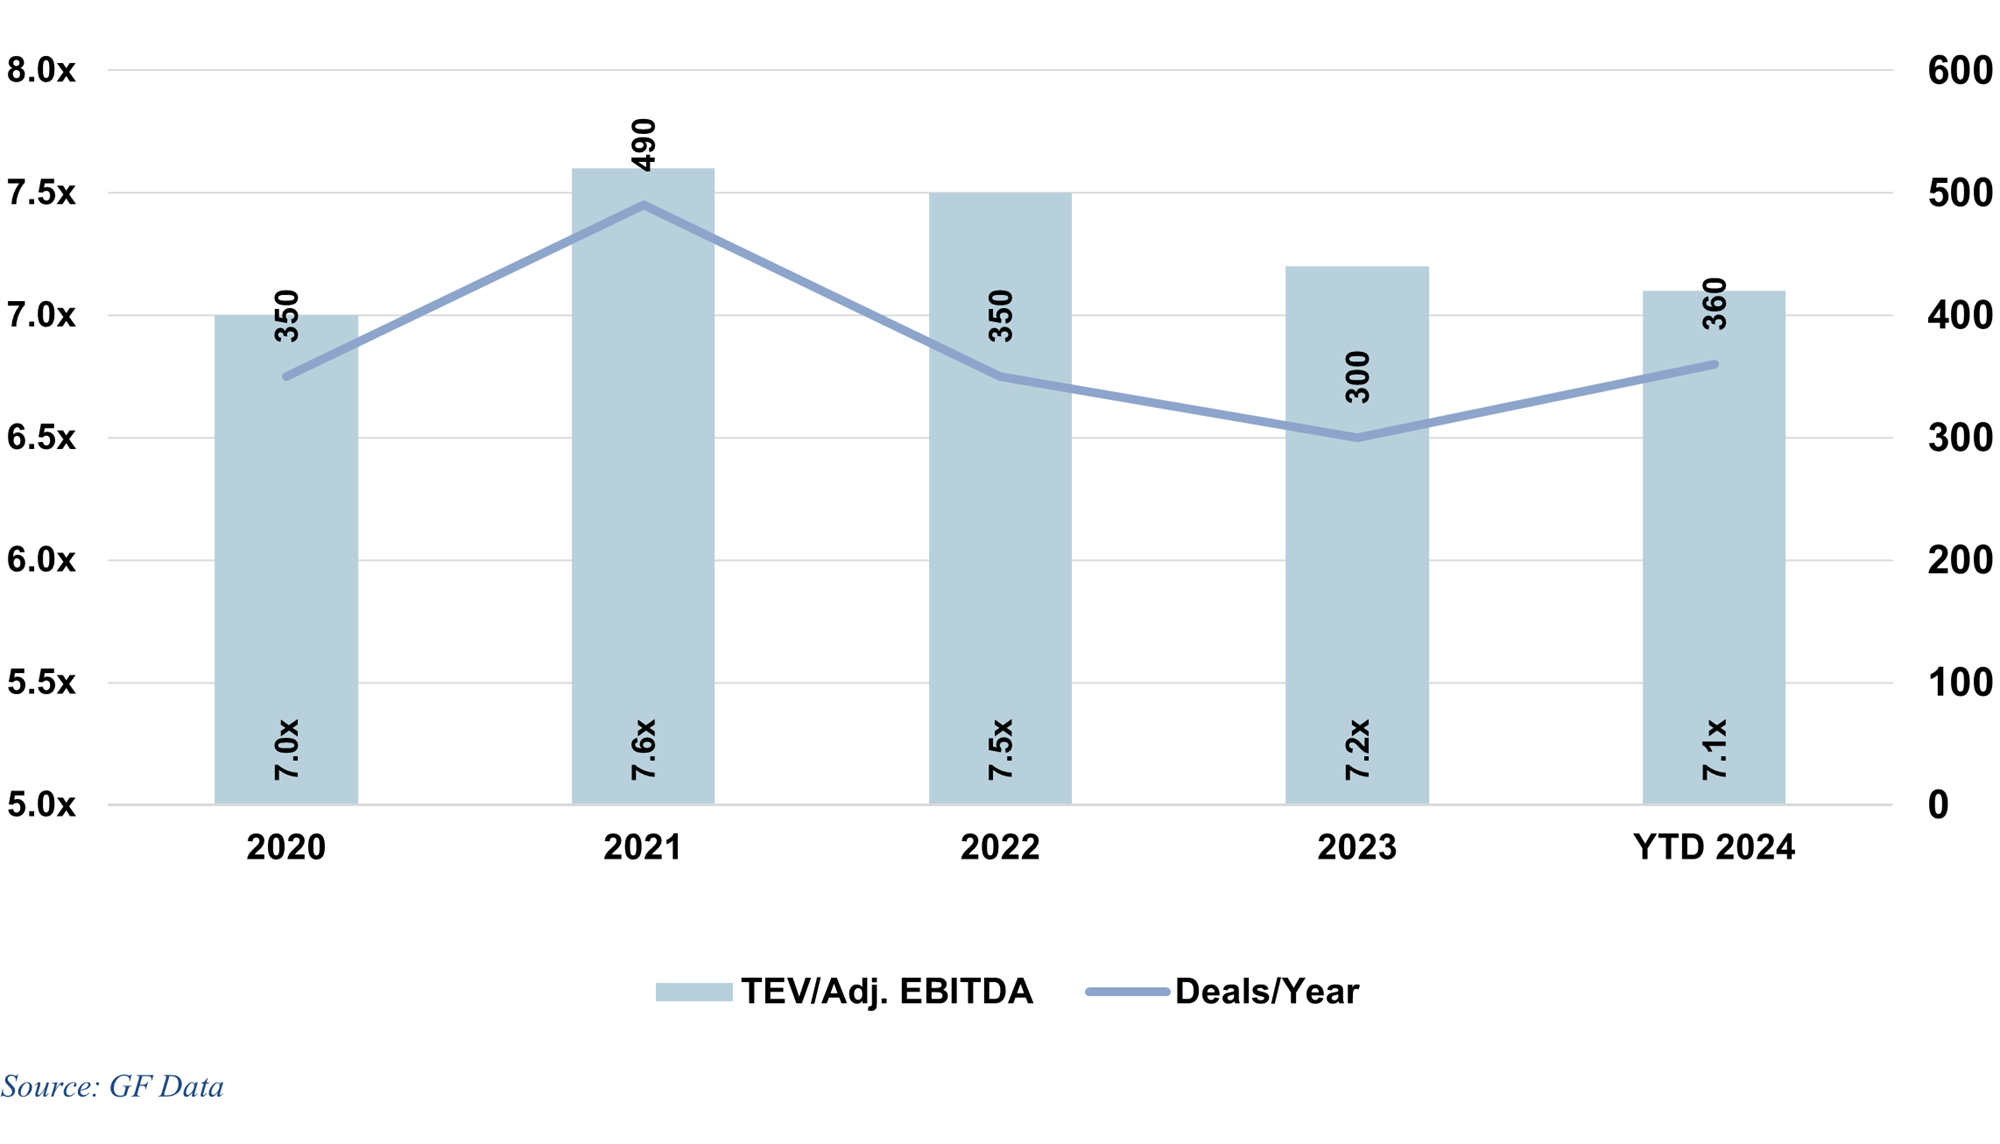
Average Multiples & Deal Volume

Source: GF Data, “August 2024 Report,” gfdata.com.
TEV/EBITDA – Quarterly Splits

Source: GF Data, “August 2024 Report,” gfdata.com.
TEV/EBITDA – By Industry ($10–$250M TEV)

Source: GF Data, “August 2024 Report,” gfdata.com.
Valuation Metrics: General Commentary
- When considering valuation metrics, we’ve included transaction data less than $500 million in enterprise value, with the data provided by GF Data, an Association for Corporate Growth (ACG) company. While confidentiality considerations prohibit data releases on specific deals, this data set offers compiled and segmented data around a variety of key factors, including industry and company size. The data set is compiled quarterly from transactional deal statistics provided by over 400 private equity firms to GF Data.
- GF Data’s “August 2024 Report” reported 180 transactions completed in the first half of 2024. This represented a 23% YOY increase in volume for transactions in the $10 to $500 million range. As noted in the “Average Multiples & Deal Volume” table above, the average TEV/EBITDA multiples for this year’s closed deals was 7.1x, a level comparable to the prior year.
- On a quarterly basis, the 7.4x TEV/EBITDA multiple in the second quarter was the highest quarterly level in over two years. Valuations were particularly strong in the sub-$100 million segment. This reflects an environment in which seller quality and value expectations are properly uniting with the growth agendas and capital deployment objectives of financial buyers.
- In an industry setting, manufacturing, business services, and distribution companies traded above their longer-term norms. Conversely, healthcare services, retail, media and telecom, and technology companies traded slightly below their historical averages.
If you have any questions or need assistance, please contact a professional at Forvis Mazars.
