
The new Microsoft Dynamics 365 Hierarchical Relationship Visualizer can help sales teams manage complex customer data through intuitive parent-child relationship visualizations. This feature, available in Dynamics 365 Sales, can help business development teams unlock insights into client organizations. By presenting relevant information visually, sales professionals can quickly spot meaningful connections efficiently without needing to manually piece together account structures.
When sales teams work on complex customer records that have multiple contacts, accounts, locations, and other related data, it can be easy to lose track of various touch points and nuances that exist within multifaceted client relationships. There may be data silos relating to the various parts of the business. For example, a sale completed by a different region or industry did not go well, and the sales representative working on a new deal may not know that historical information and be destined to repeat the same mistake. It’s important to be able to present complex customer relationships in a straightforward visualization and help sales teams understand such complexities and guide their actions toward successful engagement.
Feature Details
The Hierarchical Relationship Visualizer can help sales teams view and work with data using simple parent-child relationships. The legacy hierarchy control was deprecated in October 2024; however, it was available to use through October 2025, now replaced by this new hierarchy control.
Intuitive Design
Users can zoom in and out, as well as expand and collapse branches, helping them efficiently work with customers of different sizes. The display mode can easily switch between horizontal and vertical, depending on the general shape of the hierarchy. Users can edit data by selecting tiles, which opens a side pane where they can add meeting notes and update fields without leaving the hierarchy view.
Check Your Release Version
Hierarchy control was deployed in Dynamics 365 Sales version 8.3 and is available now. To see what version you are on, click the Settings gear icon (in the upper right of the application interface), go to Advanced settings, and Solutions history in the left navigation. Search for msdny_SalesApp and view the version. A version of 9.0.25083.#### indicates: version 9.0, 2025, release 8.3.
A future update for this feature will add support for complex, cross-table hierarchies and is planned for general availability in February 2026.
Getting Started
Once this feature is deployed in your CRM environment, admins will see a new menu option, “Visual hierarchy” in the App settings menu. They will be able to create and publish hierarchies in the environment. Once published, system users will see a “View hierarchy” button on the command bar to view the hierarchy for that record.
Security Requirements
System administrators will have access to the hierarchy visualizer by default. Non-administrator roles that need to view the visualizer will require an update to any security roles to allow users to see this new functionality.
The table required to be updated for security is called Hierarchy Configuration under Custom Tables in the security role configuration. View-only users should have Read permissions. Permissions such as Create, Write, and Delete can be enabled for system users who need to create new visualizations.
 Click here to open image in a new tab
Configuration
Administrators or users with Create and Write permission to Hierarchy Configuration tables can define hierarchy views for their teams. Currently, this feature supports single-table hierarchies, with multi-table hierarchies coming soon.
How to Create a Hierarchy View
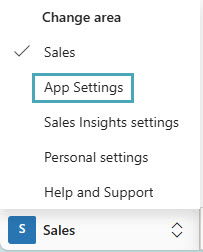
In the Sales Hub, change the area to App Settings.
 Click here to open image in a new tab
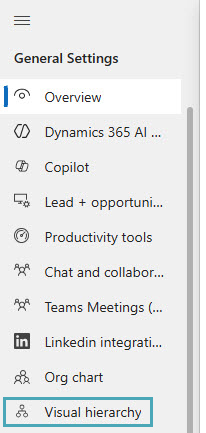
Under General Settings choose Visual hierarchy.
 Click here to open image in a new tab
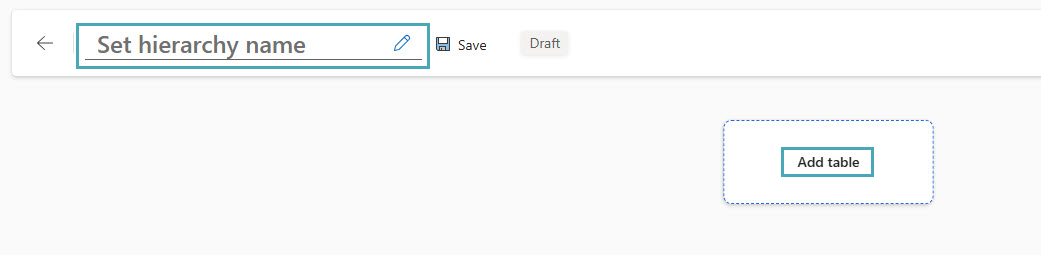
Then, choose New. Add a hierarchy name, then click Add table to select the table where the visualizer will be created. The name is in the background only and can be as simple as “Account Hierarchy.”
 Click here to open image in a new tab
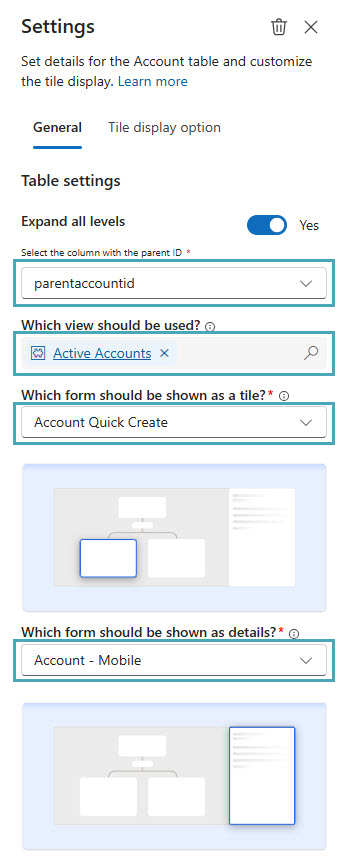
When the table is selected, more options appear on the right side of the screen.
Select the column with the Parent ID: Choose the option that determines what column on the selected table is the base of the hierarchy. In many cases, for Accounts, this will be parentaccountid (Parent Account).
- Which view should be used? This is where the view can be defined. It defaults to the “Active” view for the selected table, but any system view can be selected. This drives what records will be visible in the hierarchy visualizer.
- Which form should be shown as a tile? Any form can be selected to use as the tile in the hierarchy visualizer. Tiles are limited to show seven columns, and only basic data types are supported. Basic data types include text, date, and numbers. It may be helpful to create a new form specifically for this purpose highlighting important data to be seen on the tile.
- Which form should be shown as details? Any form can also be selected here. This setting displays an expanded view of a record when the tile is clicked, allowing users to see more detail without leaving the page they are on.
 Click here to open image in a new tab
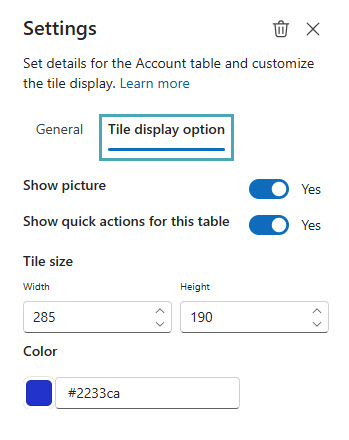
When forms are selected, use the “Preview” option in the command bar to see what this will look like to end users. Here, you may realize that the tile size needs to be adjusted to better fit your data. The Tile display option tab in settings allows you to adjust the tile size and color.
 Click here to open image in a new tab
Once you are ready to make this available to all system users, select Save and then Publish in the command bar.
 Click here to open image in a new tab
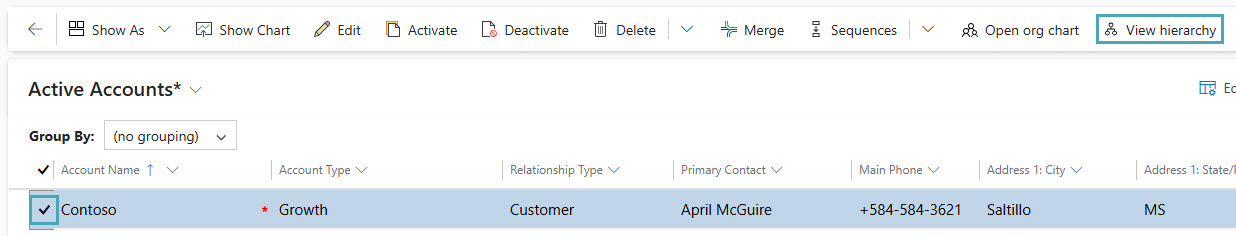
Once published, users can select an account from the list view, and View hierarchy will show in the command bar.
 Click here to open image in a new tab
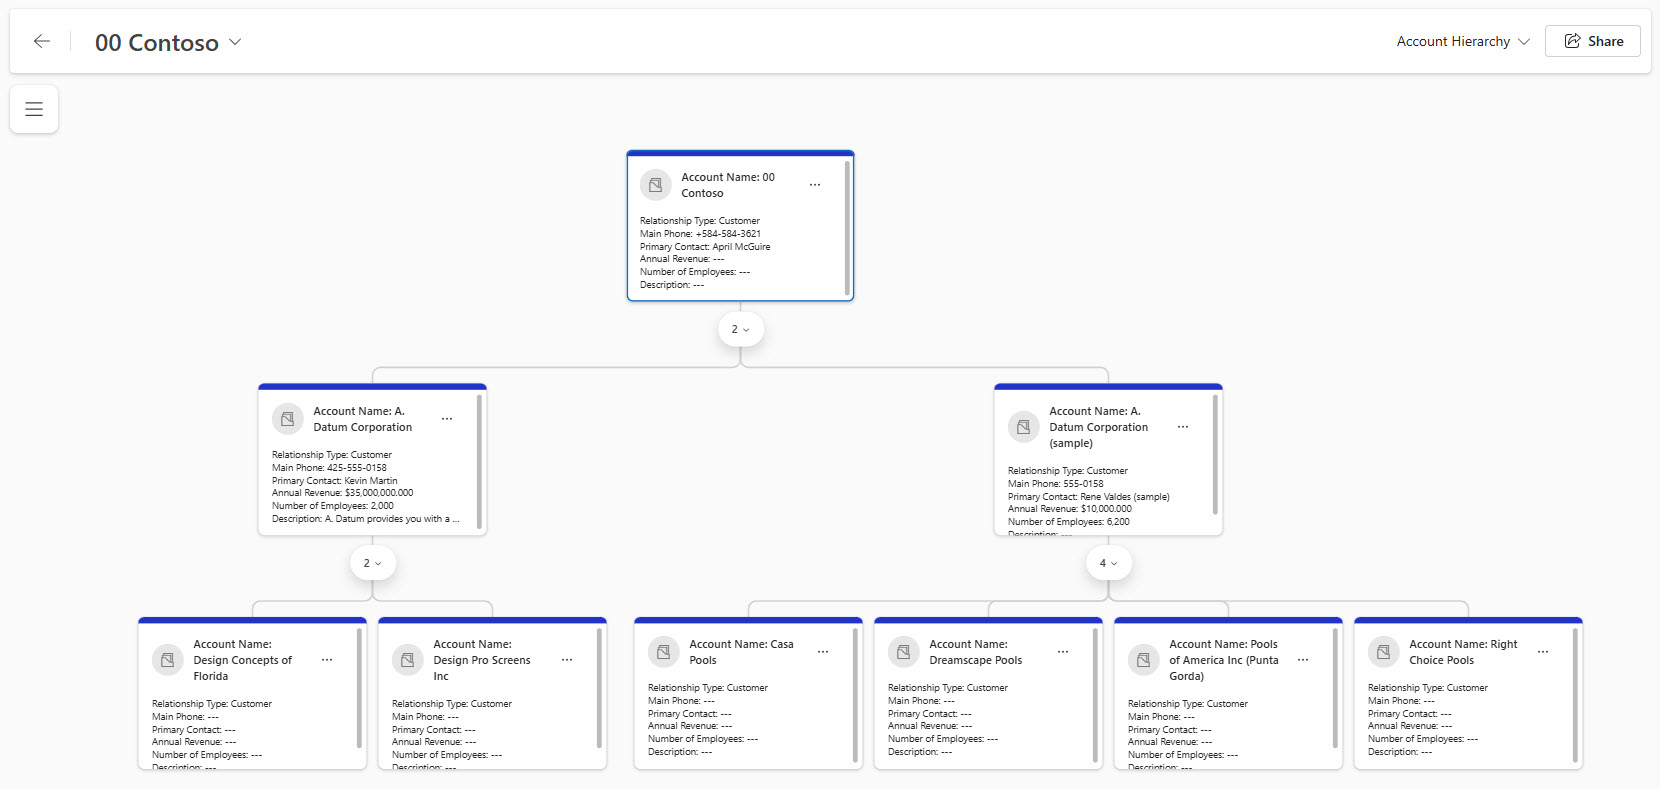
In addition, the record count can be clicked to expand or collapse levels below.
 Click here to open image in a new tab
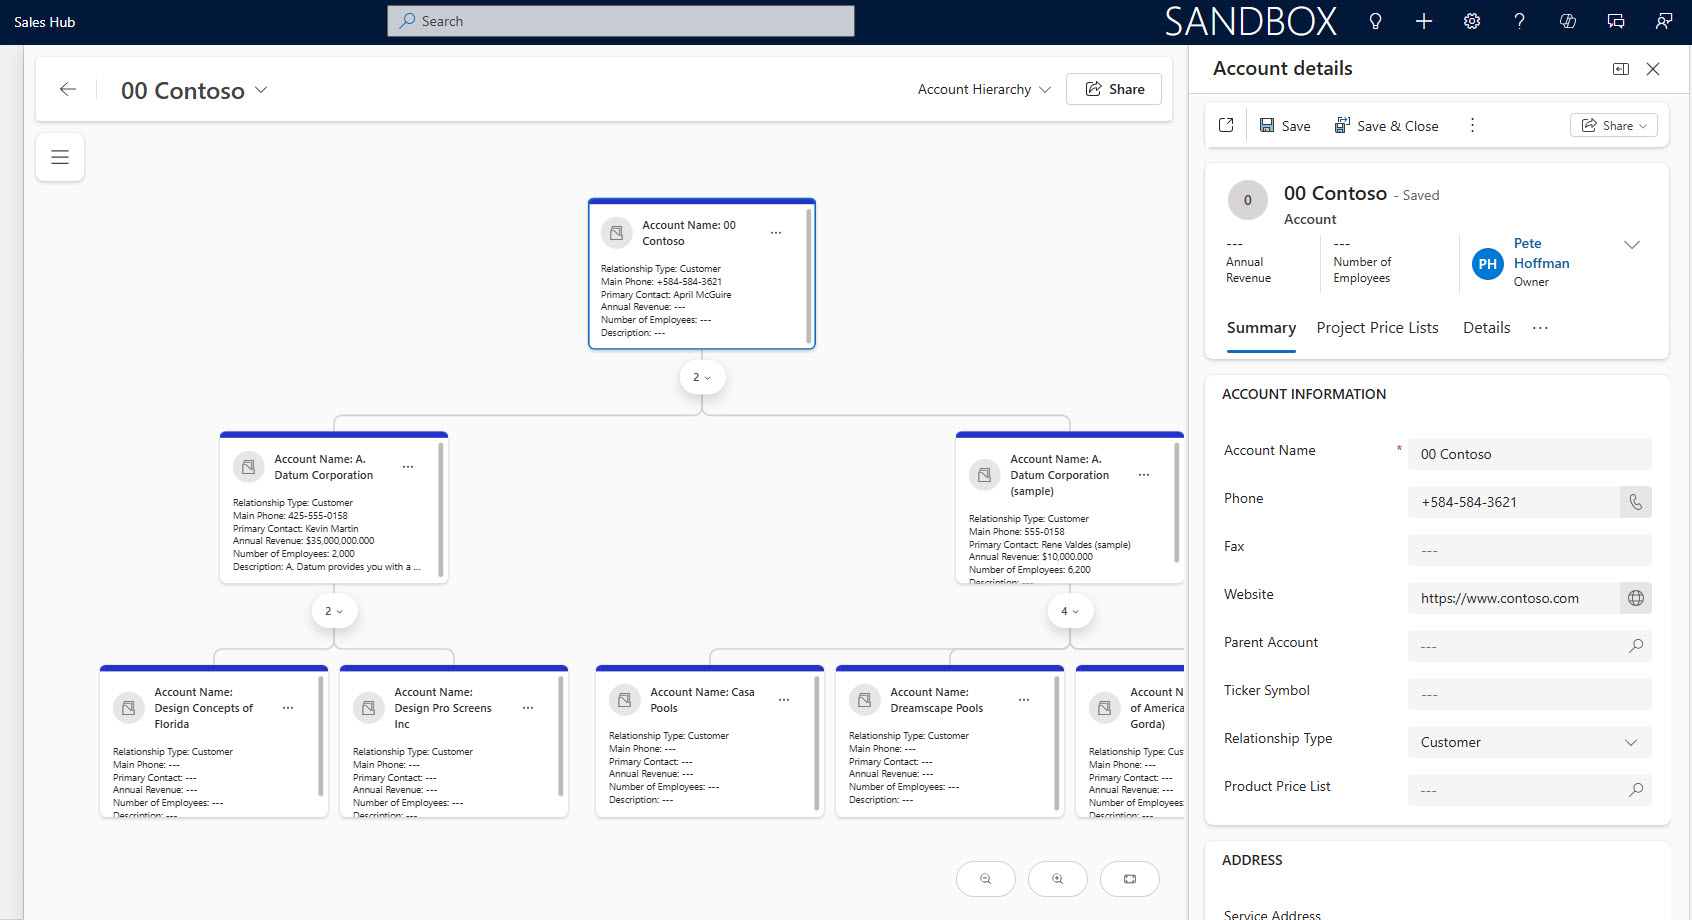
Clicking on a tile displays the enhanced view from the form selected as the details form.
 Click here to open image in a new tab
Quick Review
- Hierarchy control replaces legacy system: The new visualizer replaces the deprecated legacy hierarchy control, offering improved visualization and interaction with customer data.
- User-friendly design features: Users can zoom, expand, collapse branches, and switch display modes between horizontal and vertical. Editing is streamlined via side panes without leaving the hierarchy view.
- Configuration and security: System admins and users with advanced permissions can create and publish hierarchy views using the Visual hierarchy menu option.
- Synopsis: The Hierarchical Relationship Visualizer introduces new ways to view data and inform teams. For detailed guidance on configuration and usage, refer to Microsoft Learn documentation.
Key Reasons for Enabling This Feature
- Reveal connections: Visual maps display related accounts, contacts, and opportunities often missed in lists. Identify wins in subsidiaries to inform strategies for parent organizations.
- Accelerate decisions: Clear hierarchies can help simplify organizational complexity and reduce missteps that can occur when historical context is missed.
- Increase productivity: View, edit, and create records in one place, reducing navigation time and supporting efficiency.
- Clarify influence: Highlight decision makers and influencers to support tailored engagement.
- Adapt to priorities: Administrators can customize views to display key fields, such as revenue or risk indicators.
- Improve collaboration: Shared visuals provide a consistent view of relationships, fostering cohesive teamwork.
How Forvis Mazars Can Help
Leveraging a certified Microsoft Partner can help you unlock the full potential of these updates in your Microsoft Dynamics 365 Sales system. Our certified and experienced technology consultants are ready to help you prepare and implement upgrades to help your sales team build momentum. Connect with the Microsoft team at Forvis Mazars to explore how our professionals can assist you in getting more value from your business technology.
Related reading: