
Most organizations have migrated systems at one point. When a company migrates systems, the question comes up about what to do with all the legacy data. It can be difficult, if not impossible, to import legacy data into a new system. However, if you want or need to report data from old and new systems together, how do you do it?
This situation calls for combining the data in a way that facilitates reporting. The ideal way to manage this combination of data is in a database, like a data warehouse. There are many different data warehouse tools available. This article is going to use the Solver xFP&A Suite Data Warehouse to demonstrate a means to achieve this data combination. Specifically, this article will discuss how to use the Solver xFP&A Suite Data Warehouse to store legacy and new data, and will present report templates and Ad Hoc Reporting examples to demonstrate how the data can be displayed.
Solver is a cloud-based solution that includes a data warehouse, reporting, and planning functionality. The data warehouse utilizes a star schema. Star schemas are good for creating data models, such as in Solver and Microsoft Power BI.
Solver’s Data Warehouse includes these components:
- Modules, i.e., tables that store the activity, like sales and GL data
- Dimensions, i.e., tables that store master records, like customers and accounts
In Solver, here are the steps typically used to build out a data warehouse.
- Create the module – Define the name and columns.
- Create the dimensions – Define the name and columns.
- Connect the module and dimensions – Identify which dimensions are going to be used.
Here are examples of modules and dimensions:
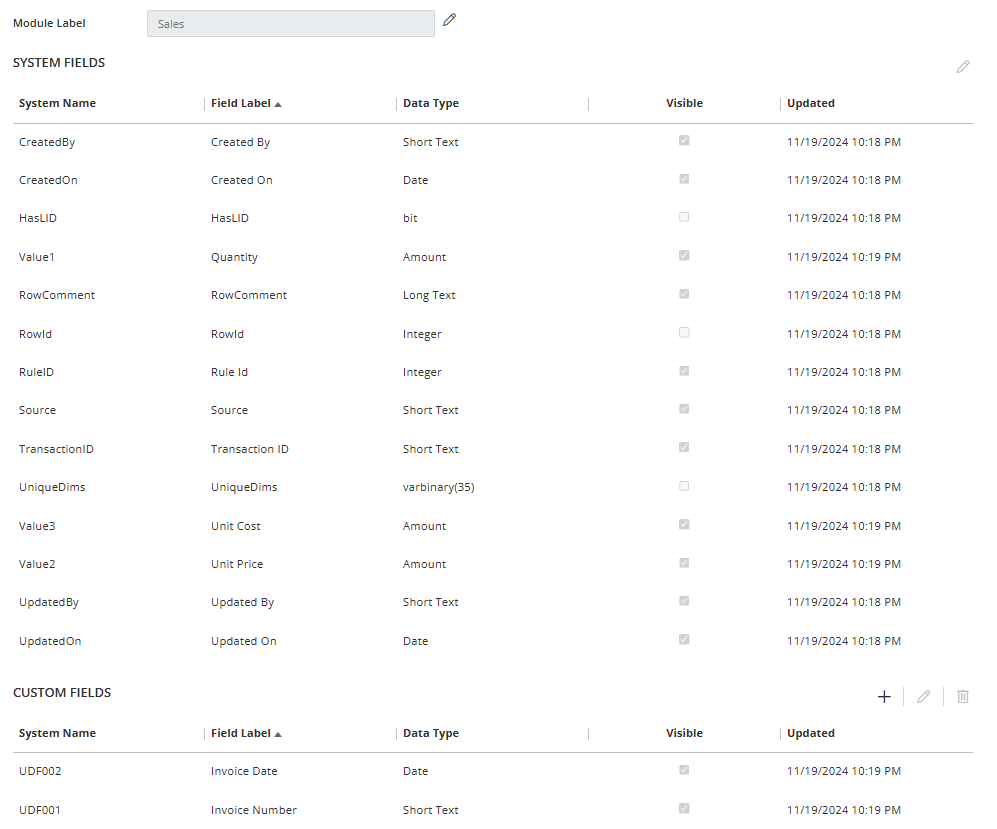
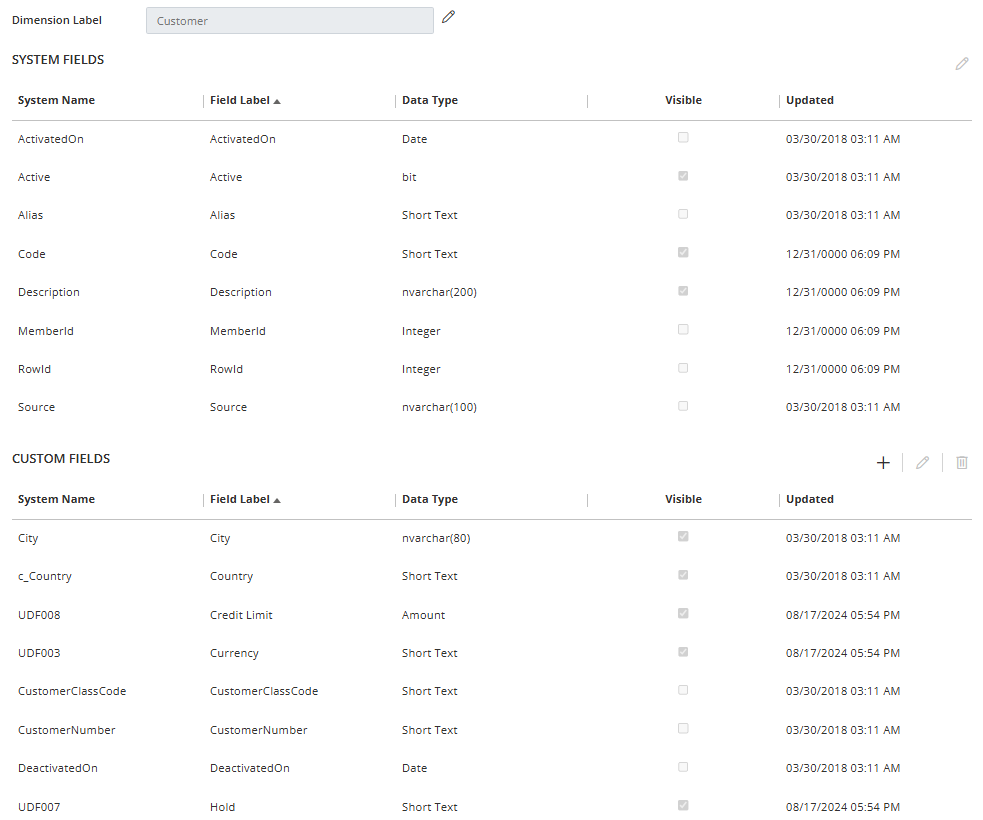
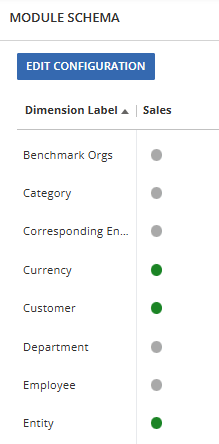
After creating modules and dimensions, the next step is to use the Module Schema window to select the dimensions the module will use. Modules can share dimensions. With this functionality, you don’t have to create and maintain multiple dimensions.
When beginning your data migration, there are some important considerations:
- Column name differences
- Column purpose differences
- Data differences
- Inconsistent columns
- Duplicate data
- Identifying Old and New
Column Name Differences
In the old data, a column may be named “Customer No.” In the new data, the column may be named “Code.” Over time, the old data may no longer be used or may be less important. Therefore, the argument is in favor of matching the old data to the new data. That is, name the column what the new system calls it.
Column Purpose Differences
There may be different uses of columns. Perhaps a column in the old data stored data differently than the new system in the same column. For example, a client’s old system stored item numbers differently in the item number column. Issues like this need to be considered to help ensure accurate and meaningful reporting.
To handle this situation, you will need to understand when viewing the data that the old data and new data are handled differently, transform the old data to match how the new system stores it, or put the old data in a separate column. Ideally, you can transform the data to match.
Data Differences
This type of difference is very common. An example of this type of difference is when a customer number was “12345” and is going to be “ACME.” A best practice for handling this situation is to create a cross-reference table. This table can be applied outside of the data or could be stored in the data warehouse and applied to the old data.
You may, for historical purposes, want to know the old customer number. One easy option is to create a new column called “Historical Number” and populate it with the old number. When querying the data, you can view the old number and the new number.
Another issue that may arise, if you already created the new data without a cross-reference table, is a need to combine the data after-the-fact. It may be useful to put the data in separate lists and match them using names. Matching may prove difficult if name changes have occurred. However, there are techniques to make the names closer. You can also use technology to compare data using fuzzy searches.
Inconsistent Columns
Old and new systems may have some columns in common. There may be columns in the old system that are not in the new system and vice versa. The first thing to do is determine if old columns are useful. If they are important, you can add them to the table definitions. You will need to recognize, either by knowledge or by adding information to the data, that old or new data does not have data for the columns.
Duplicate Data
This issue can cause issues and make reporting inaccurate. For example, you may import open orders into a sales module. In that case, both the old and new systems will have those orders. How do you handle that situation?
Start by removing the duplicate data and determining if the records from the old data or the new data will be kept. A best practice is to use the new system’s data because that is the data that will be used going forward. To remove duplicate records in Solver, use a Rule to check for and delete data.
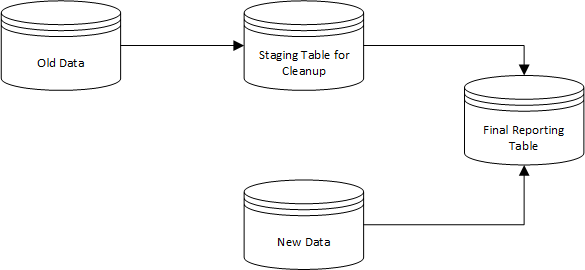
Another strategy to use with old data is to import it into a separate table for cleanup. With the separate table, you can run Rules, which are like queries, to clean up the data. Once the data is in good shape, a Rule can be used to push the data into the new table.
Identifying Old & New
It can be useful to understand where data originated. Some reasons for identifying data sources include querying either old or new data in the same table and cleaning up data. You can add a column to the data to identify the data source. In Solver, you can create a dimension named “Source Data” and then filter on that dimension. Dimension filtering is much faster than querying a standard text field.
Here is a graphic that shows one option for merging the data:
Reporting
With the data merged, you can go about creating reports and querying the data. Solver has two functions for reporting: Report Templates and Ad Hoc Reporting. These two functions enable users to have standard reports that can be run and the results shared and, in the case of Ad Hoc Reporting, querying the data when a standard report does not exist.
Report templates are created using Excel and a Solver add-in.
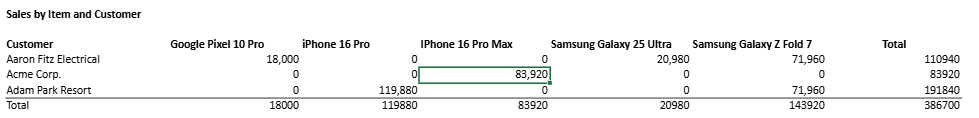
Here is the output of a simple report showing totals by customer and item:
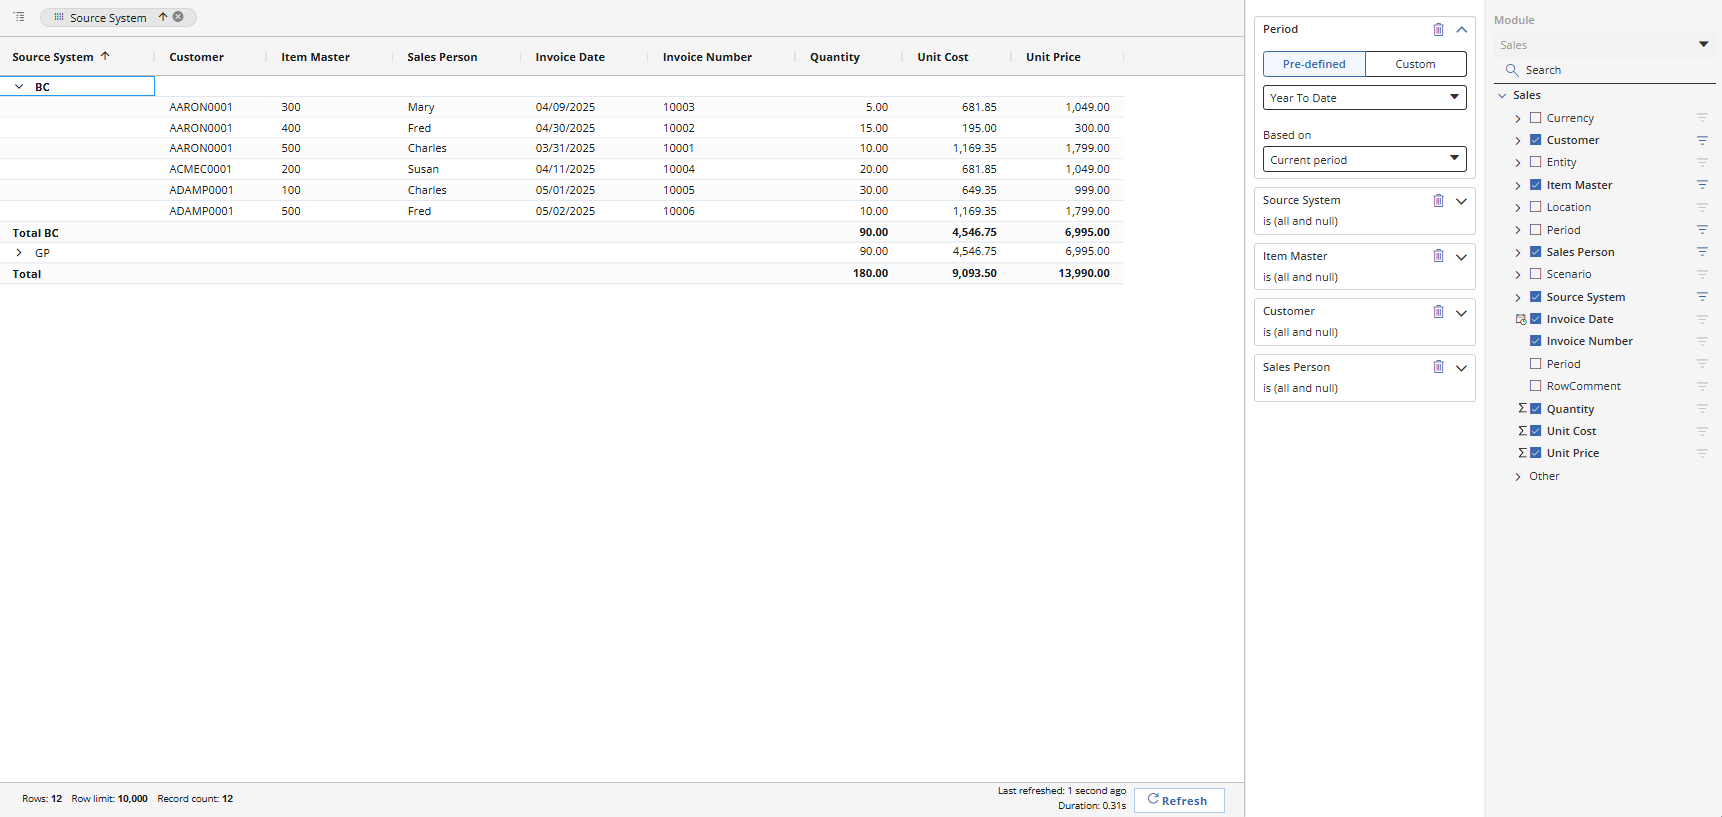
Solver reports automatically include drilldown. The next image shows a drilldown page where the data came from two different source systems.

Ad Hoc Reporting provides users with the ability to query the data. These reports can be saved and shared with other users if the other users have security to view the underlying data. The reports can also be exported to Excel.
How Forvis Mazars Can Help
In conclusion, the Solver xFP&A Suite Data Warehouse can be an option for combining multiple sets and types of data from multiple systems. Our experienced technology consultants can help you review data migration best practices and data warehouse solutions. Forvis Mazars is a certified and award-winning partner of Solver Global. Connect with us today to request a demo and learn more about Solver.
Related content:
- Case study – Streamlining Accounting Processes: How NEC Financial Services Uses Business Central & Solver
- Video – Business Central With Solver xFP&A: Transforming Reporting
- Using Solver as a Data Source for Power BI
- Unlock New Levels of Productivity With a Complimentary GP Assessment
- Watch on-demand – Turn Your Data Around With Solver & Power Automate