
Last Updated: April 16, 2026
For public school districts across the U.S., transportation budgets have become a source of chronic financial strain. Despite careful planning, a persistent gap between projected and actual spending diverts millions from educational priorities to cover operational overruns. This is a systemic, widespread issue, with annual spending exceeding $28 billion and per-student costs rising dramatically.1 The solution lies not in incremental adjustments but in a fundamental shift to a data-driven management model that transforms transportation from a reactive cost center into a predictable, strategic asset.
Budget Overruns: Root Causes
The gap between budgeted and actual spending is caused by a cascade of interconnected pressures that traditional, static planning cannot manage. Besides fuel price volatility, the most significant factors include:
- Driver Shortage & Overtime: Affecting more than 90% of districts,2 driver shortages force costly measures like route consolidation (which increases mileage and overtime), the use of non-transportation staff as drivers (creating productivity losses elsewhere), and higher wages to attract limited talent.
- Driver Idle Time: Unproductive time, including waiting time, can account for a substantial portion of the drivers’ cost portion of the overall budget.
- Growing Complexity: The rise of school choice and mandated transportation for students with special needs also impacts standard, geographically clustered routing. Routes are now longer, more intricate, and inherently less efficient and more expensive to operate.
The levers to control spending, however, depend fundamentally on how drivers are paid. Districts that compensate by the minute/hour confront a different cost‑creation mechanism than those that pay a flat rate per run or per day. Across districts, the same operational forces create stress: driver shortages, route complexity, e.g., school choice and special education (SPED), and day‑to‑day disruptions.
Under time‑based pay, these pressures surface as overtime and paid idle minutes. As drivers clock in and clock out, overruns happen mostly because of:
- Overtime accrual
- Paid idle time
- Deviation from plan
Among these variables, driver overtime stands out as one of the most unpredictable and financially damaging line items. It is a direct consequence of operational inefficiency—every route delay, vehicle breakdown, or driver absence can trigger premium pay. Controlling overtime is not about limiting hours but about fixing the systemic failures that cause those hours to accrue.
Under flat-rate pay (per run or per day), they show up as more runs, more drivers, and larger standby pools:
- Run proliferation and capacity creep
- Underutilized driver time
- Complexity premiums
The Solution: From Raw Data to Financial Control
The key to mastering these costs is already within reach. Most districts have invested in fleet management platforms, e.g., Tyler Technologies, Samsara, or Synovia, that generate a constant stream of data from on-board GPS and telematics. The challenge is leveraging this data for deep operational analysis. Your existing ecosystem—routing software, telematics, ridership, and parent apps—should operate as a closed loop for planning, executing, monitoring, and analyzing. In other words, the analytical lens differs as time-based models trigger questions such as “Where are minutes leaking?” while questions like “Where are unnecessary runs being created?” are relevant for flat-rate models.
As a result, the two models require distinct operational playbooks:
| Operational Pressure | Time-Based Pay Risk Path | Flat-Rate Pay Risk Path |
|---|---|---|
| Driver shortages | Overtime + idle minutes | More runs + larger standby pools |
| Route complexity (SPED, school choice) | Longer total minutes | Route splits → new runs |
| Daily disruptions | Minute overruns | Extra runs or backup drivers |
| Late schools or delays | Paid idle + long shifts | Additional coverage runs |
| Inefficient routing | Excess paid minutes | Underutilized driver time → fixed-cost waste |
By conducting an in-depth “time and motion” study of the fleet and drivers, managers can move from guesswork to an evidence-based diagnosis of inefficiency. This involves:
- Planned vs. Actual Analysis: Overlaying GPS data onto planned routes to identify deviations that add time and mileage.
- Schedule Adherence Monitoring: Tracking arrival and departure times for every stop to pinpoint specific circumstances that consistently trigger overtime.
- Engine Idle Time Analysis: Quantifying extra paid time (and fuel cost) from buses left idle unnecessarily.
By gathering and mining available and relevant data, school transportation executives and CFOs can move from guesswork to an evidence-based diagnosis of inefficiencies. A granular analysis reveals the true root cause of overruns, allowing for targeted solutions. A problem initially blamed on a driver might be revealed as a systemic issue with school schedules, sub-optimal routing software, or a vehicle in need of preventive maintenance.
The Modern Toolkit & the AI Frontier
Effectively using this data requires an integrated technology ecosystem where routing software, telematics, driver tablets, student ridership systems, and parent communication apps work in concert. This creates a closed-loop system for planning, execution, monitoring, and analysis.
The next frontier is leveraging artificial intelligence (AI) and machine learning (ML) to move from reactive analysis to proactive control. AI-powered dynamic routing can analyze real-time traffic, weather, and road closures to adjust routes on the fly, helping prevent delays before they happen. This capability directly mitigates the primary drivers of budget overruns—overtime and excess fuel consumption—and helps build a new level of financial resilience into the system.
A Road Map for Successful Implementation
Adopting this model is a change management project that rests on three pillars:
- People: Gaining buy-in from drivers by promoting adherence to policies.
- Process: Redesigning workflows to leverage real-time data and establishing data-driven key performance indicators (KPIs).
- Technology: Framing technology as a tool for enhanced operational (and financial) performance, as well as safety.
By embracing this data-driven framework, financial leaders can transform school transportation. They can close the gap between projected and actual expenses; help enhance budget predictability; and, most importantly, protect funding for what matters most: the students in the classroom.
Appendix: Case Study in Data-Driven Transformation
Our client is a major public school district in the U.S. catering to more than 30,000 students. Chosen driver pay model is time-based (clock-in and clock-out). Finance has been challenged with a ballooning transportation budget in the past three years. Despite initiatives to increase the number of drivers and improve routes and the bus system, a substantial gap between projected and actual expenses continued to weigh on financials, presumably due to driver inefficiencies.
Context
Forvis Mazars was engaged to identify the underlying causes of the budget overruns and suggest effective remediation. Deliverables included:
- An in-depth report that detailed the extensive data analysis conclusions on the primary factors contributing to inflated costs (two years of time and motion data, hours logged by drivers, payroll, etc.), qualification and quantification of impact mostly focused on overtime and idle time inefficiencies, and recommended corrective actions, including people and processes.
- Newly built automated dashboards fed daily from available transportation data, providing a new way for stakeholders to track in near real time KPI metrics, cost drivers’ performance, and progress toward set targets.
Approach & Results
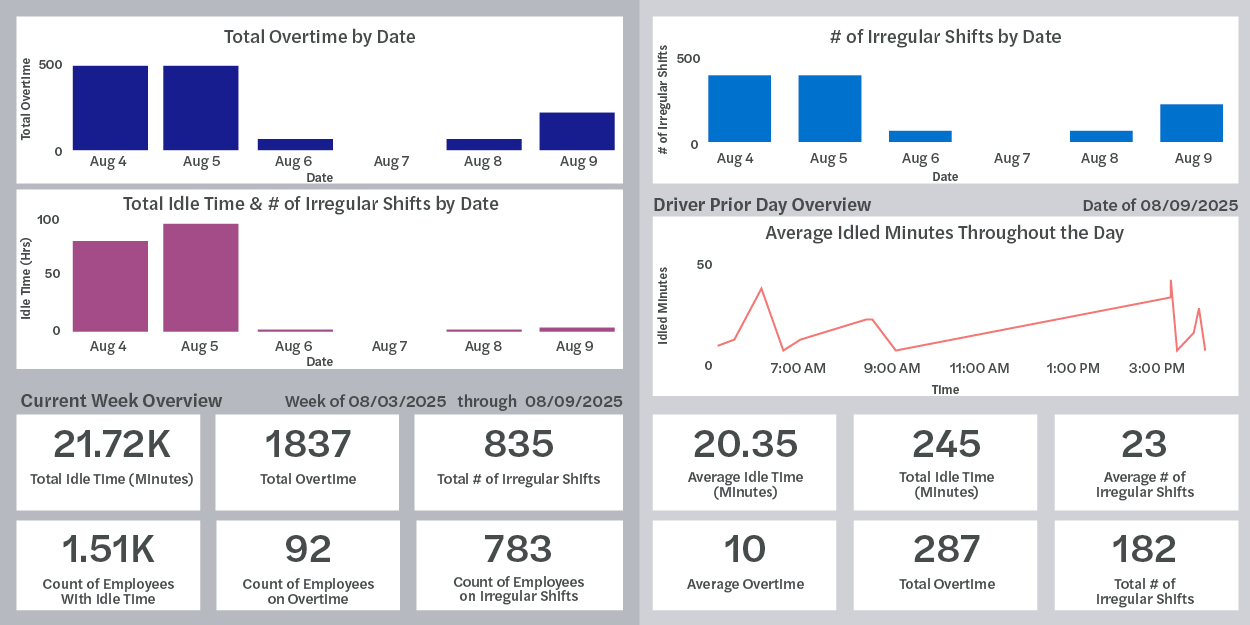
The detailed report from Forvis Mazars highlighted and quantified potential savings opportunities and created dashboards that track daily key indicators such as idle time, overtime, and non-compliant shift selections:
- An analysis of more than two years’ worth of data, extracted from the Driver System API platform.
- Approximately 50,000 hours identified as either partially or fully recoverable, i.e., incorrectly recorded.
- Progress relative to non-compliant hour logs (overtime and idle time) can be continuously tracked and monitored using newly built custom dashboards made available to the finance and transportation departments.
- Intuitive and powerful dashboards help enable:
- Reduced Time-to-Decision: The implementation of custom dashboards has provided stakeholders with daily insights into critical issues, supporting quicker, better-informed, and more proactive actions.
- Democratized Access to Data: Well-designed dashboards to help ensure that essential data is accessible to relevant end-users, fostering a collaborative environment and enhancing transparency and accountability.
- Improved Financial Performance: Addressing inefficiencies can provide a path to significant cost savings and better financial management.
 Click here to open image in a new tab
This example dashboard is for illustrative purposes only.
At Forvis Mazars, our Analytics team uses data mining skills and knowledge with leading vehicle tracking and driver behavior monitoring software to help deliver actionable insights, enable a collaborative and transparent environment, and help reduce costs. Don’t wait to potentially save on avoidable costs and reach out to one of our professionals to learn more.