
Explore how to create a matrix report that shows the vendors from whom you have purchased and the items that were purchased. In this video, we’ll show how to create a Purchases by Vendor report using Solver. The video transcription is provided below.
Related Resources
- Microsoft Dynamics GP & Solver for Advanced Reporting
- Create Fixed Assets Reports for Dynamics GP with Solver
- How to Drill Through Reports in Power BI
Do you have questions about improving your reporting and planning processes or Solver’s capabilities? Please reach out to a professional at Forvis Mazars or send us your questions.
Our Insights & Automation team at Forvis Mazars can help organizations use technologies like Solver to help gain efficiencies. Service offerings include business intelligence and technology assessments, along with software implementations and app-to-app integrations. We are a Microsoft Dynamics Partner and 2022–23 recipient of the Microsoft Inner Circle award, in addition to the Solver Evangelist of the Year award.
Transcript
0:00–1:05
Hello, my name is Charles Allen. In this video, we’re going to use the Solver Corporate Performance Management tool to create a report directly against Microsoft Dynamics GP data. This report is going to be a list of vendors from whom we have purchased items, and we’re going to show what items we have purchased over a date range.
With Solver, you have two ways to source data. One is a data warehouse, where we take data from GP or other sources and we load it into the data warehouse. The other option—that we’re going to look at here—uses what’s called the Hybrid Connector. The Hybrid Connector is a live connection from the cloud to your local GP database.
Now that local GP database, of course, could be in a hosted area as long as Solver can connect to it. All right, let’s take a look at what we have.
1:06–1:39
Looking over here in this other screen, you can see that we have Excel. Excel is used by Solver to create templates.
On the left we have the pane, the Report Designer pane, that shows the modules that we have available to us. You can see at the bottom, we have a lot more. We just ran out of room to show more. If I click on one, you can see Smart List Analytical Accounting, Manufacturer, and so on and so forth.
1:40–3:00
We’re going to do this thing on Purchase Orders. Let’s come over here and make this bigger. You’ll notice I’ve already got Purchase Order Line open. Remember, the first thing we want is our vendors. You’ll notice I have a folder here called Vendor. If I expand it, I’ve got all these Vendor fields.
Now, nicely, we have one here called Vendor With Name. That’s going to be the vendor ID with the name. So we’re going to take that and drag it into the report and put it right there. What that does, is it creates this little box here and what that box is going to do is automatically show every vendor. You can see that it’s expanding right here. Let’s make that a little bit bigger to give room.
The next thing is we want to show is our items. We’re going to show the items as columns. But of course, you can show them as rows underneath each vendor, too. Now, let’s close our Vendor [folder] and let’s go up to Item. We’re going to do the same thing: [select] Item Number With Name and put that right here as a column header. That’s going to show our items with their names.
3:01–3:21
Now, what are we going to measure? Well, we’re going to measure Extended Cost. Put that right there. Let’s go ahead and set the format for that. We’re going to go down here, and we’re going to choose this option right there:
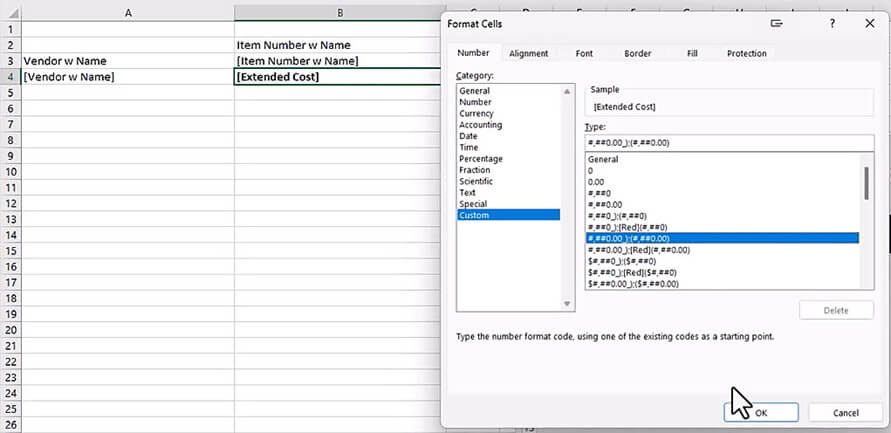
3:22–4:15
All right. Now, a couple of things: we want to only use closed PO lines and we want to be able to tell what date range we want. What we can do is go up here to this sheet filter, and if we scroll up, there’s our PO Line Status. Let’s go to that, do a lookup, and we’re going to choose Closed.
Now, what date do we want? Well, we're going to come up here and you'll notice we have First Receipt Date, Last Receipt Date, Promised Date, Promised Ship Date, etc. We keep scrolling down. We’re going to go ahead and we’re going to choose, though, for this report: First Receipt Date. We’re going to pull that and put it right there.
4:16–4:39
When I do a lookup, you can see it’s going to give me some periods, but I want the user to pick. So I’m going to go to the Parameter tab and I’m going to create a new Parameter for the user. Let’s come over here and select Date Range. Select Finish, and there’s our report. We’re going to make this a lot nicer, of course.
4:40–5:29
You’re going to want Totals. Over here, we’re going to right click, go down to Report Designer, and select Create a SUM. Then we’re going to come over to this cell, right click, go down to Report Designer, and select Create a SUM. We can do the same thing in this cell (right click, go down to Report Designer, and select Create a SUM). Now let’s apply that formatting to all of them.
Let’s put Total here in this cell and center it. There’s our formatted report. Now, of course, you could add lines and color and all sorts of good things like that, but let’s go ahead and save it.
5:30–6:11
To run this report, we can run it in Excel. We also can run it in the portal.
Go to the Run tab to test it. You’ll notice we have our date range. In the first field, we’re going to put 1/1/2027 because we’re using sample data and change the second field to 2027 also. Let’s try that again. Come over here and inspect 2027 and June 30. Perfect. Then hit Run.
6:12–7:33
While the report is running, let’s think about what we’re doing here. We’re creating a matrix. In this matrix, we’re showing the vendors from whom we have purchased and the items that we have purchased.
Now here’s one where there’s no item number; we can hide those if we want. But then here are the items that do [have an item number].
The other thing you can do in this report is drill down. For example, if I want to see “what am I buying without an item number?” I can right click on that and drill down. It can show me what that item was. If I scroll, I can see it was on PO Number 2066, who the contact was, and all that good information right there.
If I go back to sheet one and let’s say I want to review this item, I right click, select Report Designer, and drill down. You can see I bought three items, three different POs. There’s my Extended Cost information and so on.
Once we have that, and if you’re satisfied, you can hit Save. Solver then saves it to the cloud, and you can close it. Then you can have users log into the cloud or you can run it for them and send them the report.
7:34–8:11
Just like that using Solver, we created a report using live GP data, and we made it available in Excel or we made it available in the cloud. If you would like to learn more about this, contact me at Forvis Mazars or look for us on FORsights. Thank you very much, and have a great day!