
If your school is like many others, creating the course schedule for the upcoming term can be a daunting task. How many sections of a class are we going to offer? Do we hire extra adjuncts to cover a course or have a full-time faculty member teach an overload? How do we decide if it’s time to remove a course from being offered or offer it less frequently? And where will the classes be held? Given how complicated it can be to craft a course schedule, with all the competing factors, it is really tempting just to roll over everything from the prior year and make a few tweaks. It pretty much worked last year, so why mess with success?
The problem with managing your course schedule the same way each year is that if you have an operational deficit or even just a shrinking program margin, ignoring the course schedule could keep your institution from reaching its goals. Utilizing the data found in the Program Economic Analysis (PEA) model from Forvis Mazars, you can drill down into exactly what each course section is costing the institution and make informed decisions for your schedule.
Course Trends
If your school wants to try to improve its course schedule to have the right number of sections being offered for each course, you need the right data. Sometimes, a snapshot of one semester’s enrollment is enough to make sure the students who absolutely need the course can get it. But what if you could better predict which courses would need more seats in the future? Using the “Trend Analysis” feature of PEA, schools can look at course-level data to see exactly what has been happening in enrollment over multiple years. For instance, you might have enough students enrolled in your intro accounting course sections for all of them to run, but what if the average class size is decreasing over time? With Trend Analysis, you can see the pattern in the data that might tell you it is time to combine some of those sections.
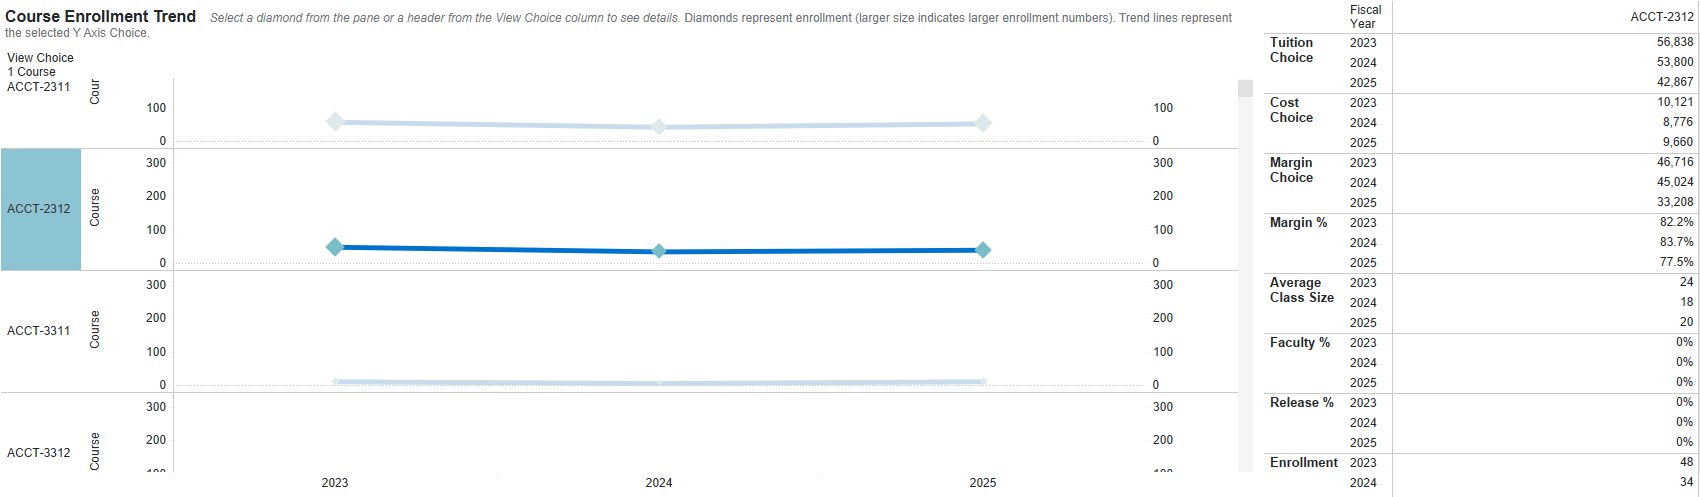 Click here to open image in a new tab
Program Trends & Benchmarking
Knowing how many sections need to be offered in the future also involves knowing which programs at your school are growing or shrinking. In addition to the program data found in the “Trend Analysis” section of PEA, which can show program enrollment trends over time, schools also gain access to “Program Benchmarking.” This new feature in PEA allows schools to analyze program trends against a group of peer institutions to see how they compare in areas such as enrollment, costs, net tuition, and average class size. Is enrollment in your biology program shrinking, for example, but is it also shrinking among peer institutions? It could be that there is a broader industry trend driving that change, and it is time to right-size your biology offerings in response.
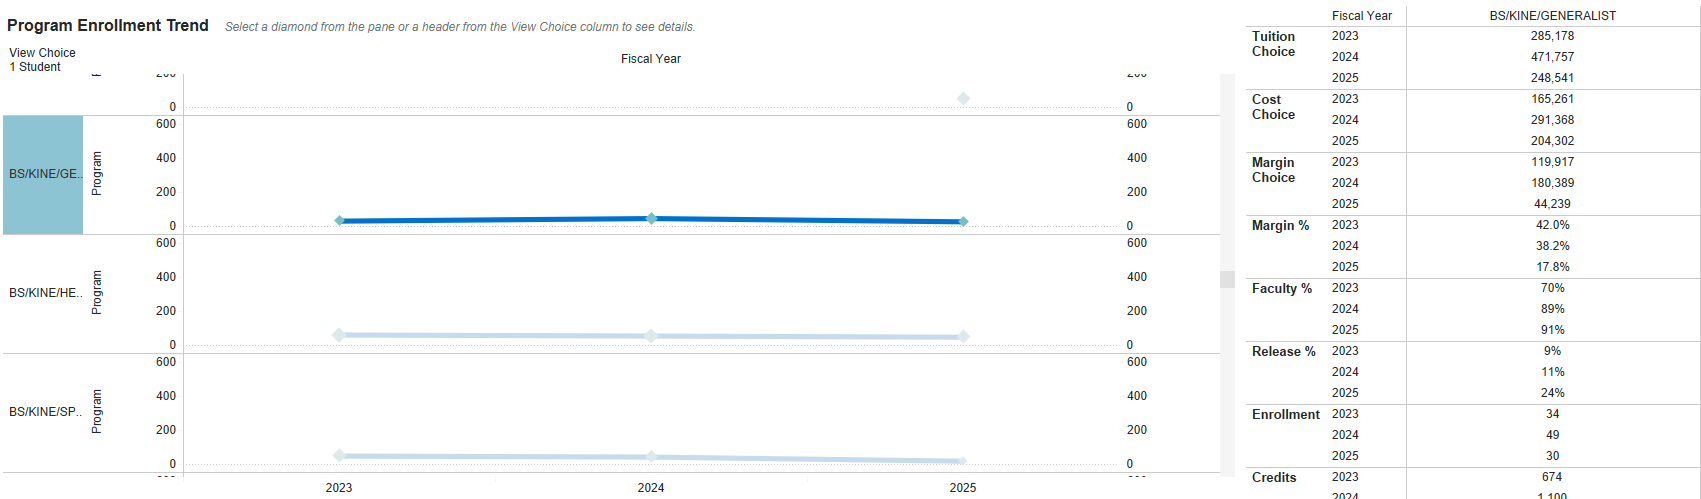 Click here to open image in a new tab
Course Margins
A question that schools are having to ask—even if the answer is scary—is, “Are we losing money when we teach this course?” There may be good reasons related to the school’s mission that might necessitate a negative margin for the occasional class. However, subsidizing courses is only sustainable for a limited time. With PEA’s “Economics” feature, schools can easily view the margin for each course and section to see where classes are generating revenue and where they are not covering their own costs. Using this data helps isolate courses where a section might need to be cut to increase overall class size. Schools can also compare the cost to offer each section to see if a different deployment of faculty might improve margins. Sometimes, just changing the faculty member teaching a section can result in a class going from losing money to making money.
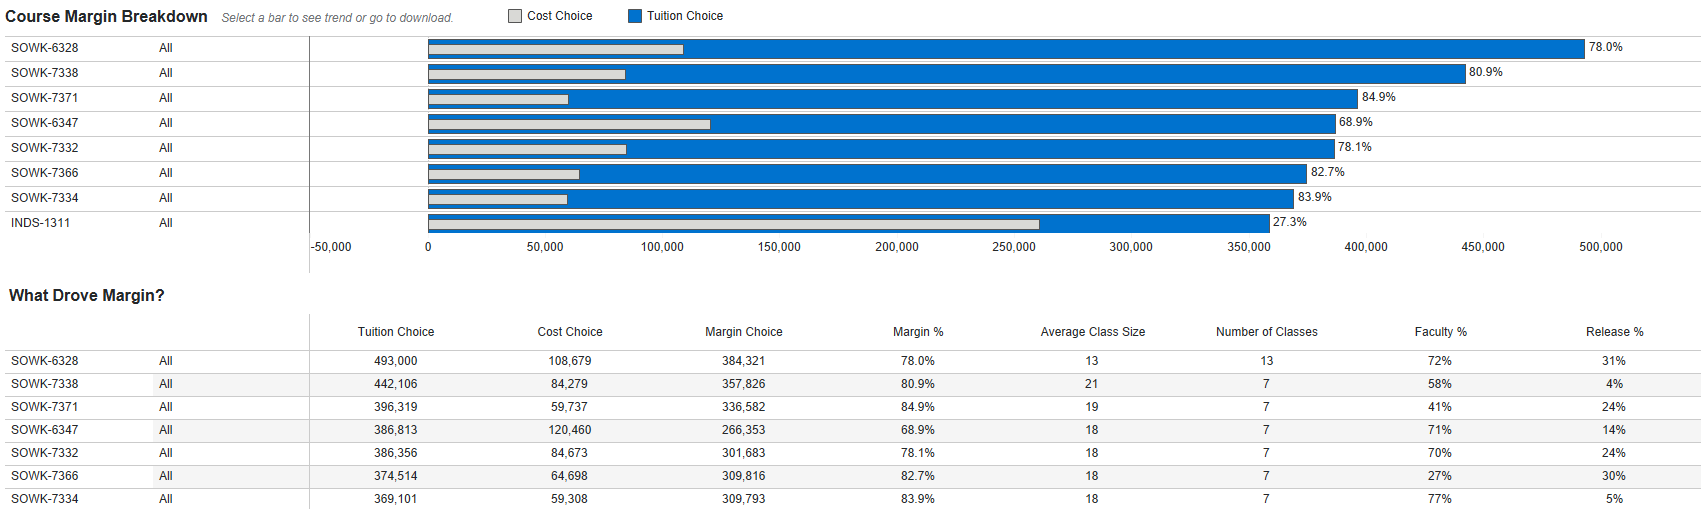 Click here to open image in a new tab
Complex Decisions Require Clear Data
Creating the course schedule can be a challenging and complex task for any school. Juggling program needs, faculty deployment, facility constraints, and course costs is no small feat, regardless of whether you are a small private school or a large public university. While Program Economic Analysis from Forvis Mazars cannot solve all of the challenges that come with creating a course schedule, PEA does provide schools with the data needed to help make important decisions about course offerings. Since PEA was designed to be used not just by your school’s finance office but also academic affairs and other non-financial offices, conversations about course margin and program trends can break out of their traditional silos and happen more holistically.
Interested in exploring how PEA can help your institution visualize and evaluate course and program trends to improve margin and enhance scheduling? Contact our higher education consulting team today!