
In today’s data-driven world, most organizations don’t have a problem with the quantity of data available to them. However, data quality can be the difference between just an X on the map and discovering a treasure chest. Data quality should be treated as a priority, not an afterthought. In this article, we define data quality and why it matters to your organization. Then we point to the benefits of clean data and the challenges of not having it. Finally, we explain what characteristics make up clean data.
What Is Data Quality?
Your organization may relate to this statistic: 97% of businesses have invested in big data, but only 40% then apply effective analytics, as noted by DemandSage in December 2025.1 The quality of your analytics can only be as good as the quality of your data. So, what is data quality?
According to SAP, data quality refers to “how relevant and reliable your data is for its intended purpose.”2 Once you know your intended purpose, you can review your available data and decide whether it can be trusted and applied to your business purpose. This is valuable because data quality can impact high-stakes items like decision making, creating strategy, and making sure your organization is complying with governance.
Why Is It Important?
With so much riding on data quality, it should be clear why it’s important to spend enough time preparing your data to make sure it’s as complete, accurate, and relevant as possible. We live in a fast-paced world, but preparing your data can’t be rushed. When first starting an analytics initiative, it is oftentimes true that most of your time is focused on preparing data to help ensure your outputs facilitate reliable, data-based decisions. The term “clean data” is used when talking about good data quality.
What Is Clean Data?
Before we explore the benefits and common pitfalls of clean data, it’s important to first recognize its characteristics and what the word “clean” entails.
High-quality or “clean” data refers to information, normally within a table, that is complete, accurate, properly formatted, and free of missing values and duplications. Its values are standardized, frequently maintained, and can be trusted with confidence.
Benefits
Clean data can enable organizations to gain clear insights into their operations. It can minimize the time spent correcting data inconsistencies–potentially leading to quicker and more reliable results and enabling leaders to confidently rely on metrics presented in reports and dashboards.
Clean data can also reveal a variety of trends that may have previously gone unobserved, which can provide concrete evidence and quantifiable insight to leaders when navigating complex decision making.
When data is clean, it not only helps ensure accurate reporting in the moment—it helps ensure accurate reporting over time. When time-sensitive data fields such as dates are accurately captured, analysts can investigate certain occurrences within clearly defined time frames, supporting the capability to present reliable trend analysis and long-term insights.
Pitfalls
There are a few common pitfalls when data is inaccurate. For example, when entering data, people often leave fields blank assuming it will have little impact. In reality, missing values can create gaps within calculations that can distort results and lead to incorrect interpretations. For example, consider a team tracking monthly sales where a few employees forget to enter their sales values during a certain month. When totals are calculated at the end of the month, those blanks may be treated as zeros. This can lead to distorted results causing the totals to appear higher or lower than normal, potentially influencing leaders to make poor decisions based on faulty information. This is a business risk of poor data.
These issues have the potential to snowball when data needs to be combined. Occasionally, multiple data tables or “data sets” need to be combined for analysis to gain a broader understanding of the organization as a whole. In this case, the assumption of clean data also includes the presence of a reliable primary key. A primary key within data consists of one or multiple columns, which act as a unique ID for each record in a table. Connecting two data sets using the primary key avoids mixing up information and creating duplicate records.
When data sets have differing values within the primary key columns, record mismatches and null (blank) values will occur in the combined data set, leading to poor-quality data as seen in the figure below:3
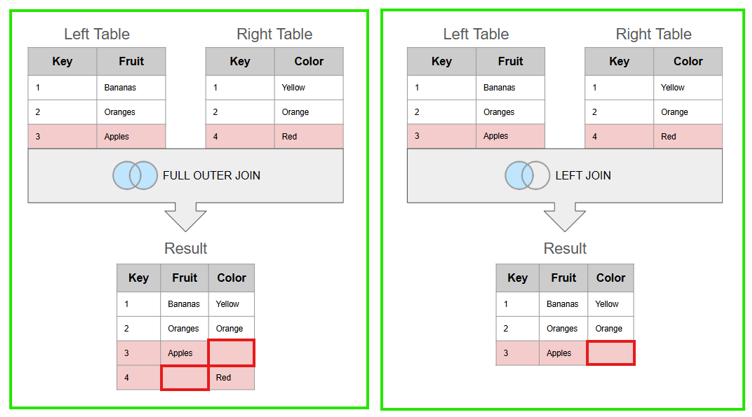
In this example, the Left Table lists the names of various fruits in the Fruit column, while the Right Table lists the corresponding color of each fruit in the Color column. After combining the two tables using the Key column (the Primary Key), Banana will join to yellow because both share a Key value of 1 and Orange connects to orange with a Key value of 2. However, Apple has a Key value of 3 in the Left Table and a Key value of 4 in the Right Table, so these records will never match together. This mismatch of keys results in missing data in either one or both final tables, depending on the type of join assigned. Having a reliable primary key to combine data sets not only helps ensure accurate results, but can harvest a collective understanding of the data when multiple teams are collaborating.
What Are the Characteristics of Clean Data?
A checklist for data quality considers how well your data satisfies the following criteria: accuracy, completeness, timeliness, relevance, and consistency.4
Accurateness
- Make sure accurate data is being captured.
- Check at a high level that aggregate numbers make sense and have various checkpoints in place.
- Check that various file formats are recognized and imported without errors.
- Keep in mind that scanned content (like PDFs) can be faulty if there are handwritten notes or watermarks.
Completeness
- Avoid NULLS (blank values). These are especially important if you are combining data tables because NULLS in the primary key columns won’t give you an accurate representation of the data.
- Consider if you have all the data fields you need.
Timeliness
- Confirm that your data set doesn’t have any untimely anomalies or timeframe outliers that could skew the data.
- For example, if a data set has a set time frame (an example is higher education with fall, spring, and summer terms), and if an anomalous term is submitted (say Summer A), this can tilt the data in unexpected and invalid ways.
Relevance
- Verify that all the data supports your analysis. Consider whether there are some data sources irrelevant to your question.
- Do you have all the data that you need to make your decisions? Or are you missing a data source that can provide the insights you need?
Consistency
- Scan your data for naming convention inconsistencies. Small formatting changes (such as VA, Va, and Virginia) can split data into separate buckets, leading to inaccurate totals.
- There will be no connection between these values unless there is formatting on the back end to normalize these values.
With the data quality principles of accuracy, completeness, timeliness, relevance, and consistency in check, your data can help answer the questions you need it to.
Forvis Mazars Can Help
Whether you are struggling with inconsistent data, looking to merge multiple systems, or unsure if your data is clean enough to give you the insights you need, our Analytics team at Forvis Mazars can help you, no matter at which stage you find yourself. We can help you set up a solid data foundation that lets you harness the full potential of your data and prepare for what’s next.